
설명
QX FrameForge 는 cTrader용 오버레이 다중 타임프레임 시장 상태 대시보드입니다. 여러 타임프레임에서 발생하는 상황을 빠르고 읽기 쉬운 패널로 압축하여 추측 대신 맥락을 가지고 거래할 수 있게 합니다.
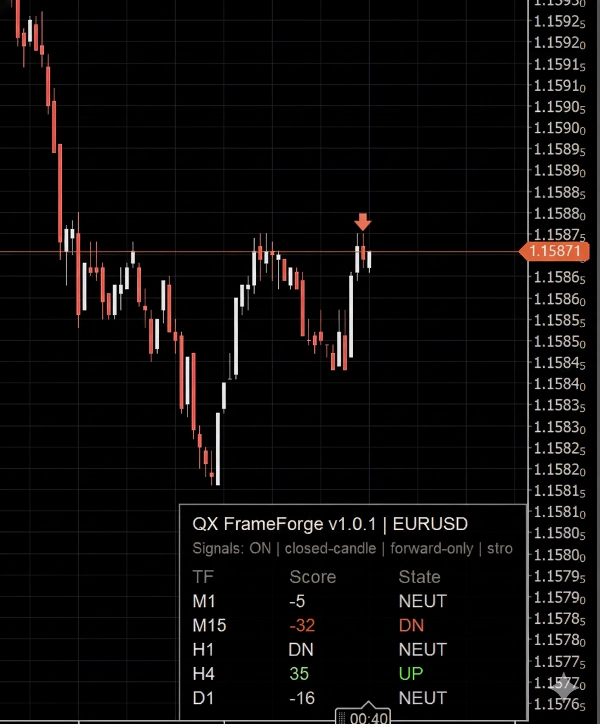
선택한 각 타임프레임에 대해 패널은 다음을 표시합니다:
- TF (타임프레임)
- 점수 (-100에서 +100까지) 방향과 강도를 표현
- 상태: 상승 / 중립 / 하락로 빠른 결정 지원
선택적으로 닫힌 캔들만 사용하여 확인 표시하는 화살표를 활성화할 수 있으며, 이는 차트를 안정적으로 유지하고 인트라바 플리커를 방지합니다.
읽는 방법 (초보자 친화적)
패널을 방향계로 생각하세요:
- 양수 점수 및 상승은 해당 타임프레임에서 강세 조건을 의미합니다
- 음수 점수 및 하락은 해당 타임프레임에서 약세 조건을 의미합니다
- 중립은 조건이 혼합되었거나 횡보 중이거나 방향성이 충분히 강하지 않음을 의미합니다
중립 구역 설정은 지표가 중립 상태로 전환되는 민감도를 조절합니다. 중립 구역이 넓을수록 방향 상태가 적어져(더 보수적)집니다.
점수 내부 구성 (고수준)
점수는 다음을 혼합합니다:
- 하나의 추세 구성 요소 (방향 및 기울기 동작)
- 하나의 모멘텀 구성 요소 (지속력 대 주저함의 강도)
- 선택적 변동성 필터로 잡음이 많은 기간을 줄임
결과는 다중 타임프레임 정렬을 위해 설계된 제한된 점수이며, “마법 같은 진입”을 위한 것은 아닙니다.
트레이더들이 일반적으로 FrameForge를 사용하는 방법
1) 다중 타임프레임 정렬
- 상위 타임프레임이 일치할 때 거래 선호 (예: H1 + H4 모두 상승)
- 하위 타임프레임 (예: M5)을 타이밍 용도로 사용
2) 시장 상태 필터링
- 너무 많은 중립 상태는 일반적으로 횡보 및 낮은 품질 조건을 의미
- 상위 TF 방향이 혼합되면 주의하거나 노출을 줄일 것을 권장
3) 확인 레이어
- FrameForge를 사용하여 설정이 정렬되었는지 확인한 후에 거래를 실행
선택적 화살표 (신호)
화살표는 선택적 시각적 도우미입니다. 마지막 닫힌 캔들 에서만 평가됩니다.
화살표가 작동하는 방식을 선택할 수 있습니다:
- 강도가 임계값을 넘을 때만,
- 방향 상태가 변경될 때만,
- 또는 조건이 강할 때 더 자주 표시.
다음에 대한 제어 기능이 포함되어 있습니다:
- 강도 임계값
- 쿨다운 (화살표 사이 최소 바 수)
- 스윙당 한 신호 (같은 방향의 반복 화살표 감소)
- 아이콘 제한 (차트 혼잡 방지)
중요: 화살표는 활성화 순간부터 앞으로만 작동하도록 설계되어 과거 객체 스팸과 오해의 소지가 있는 후향적 시각 효과를 방지합니다.
호환성
- 모든 cTrader 심볼 및 모든 차트 타임프레임에서 작동
- 지표 전용. 주문은 실행되지 않습니다.
- 차트 반응성을 유지하기 위한 최적화된 UI 업데이트.
위험 고지
거래에는 위험이 따릅니다. 과거 성과가 미래 결과를 보장하지 않습니다.
요약
The Score integrates trend direction and slope, momentum strength, and an optional volatility filter to reduce noise, producing a bounded metric aimed at multi-timeframe alignment rather than precise entry signals. Traders typically use FrameForge for aligning trades across timeframes (e.g., confirming higher timeframe trends before timing entries on lower timeframes), filtering market regimes by identifying choppy or mixed conditions, and adding a confirmation layer to their setups.
Arrow signals can be customized by strength thresholds, directional changes, cooldown periods, and icon limits to avoid chart clutter. The indicator works on any cTrader symbol and timeframe, updating efficiently to maintain chart responsiveness. It does not place orders and serves solely as a visual analytical tool.
고객 리뷰
5 | 100 % | |
4 | 0 % | |
3 | 0 % | |
2 | 0 % | |
1 | 0 % |


!["[Stellar Strategies] Market Session Ultimate" 로고](https://cdn.ctrader.com/image/webp/61ffd537-0125-4246-9e72-42eca1791d64_28232)


