

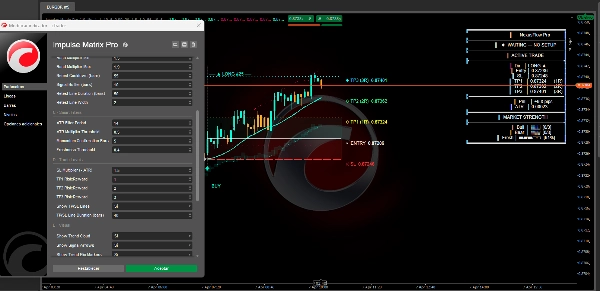
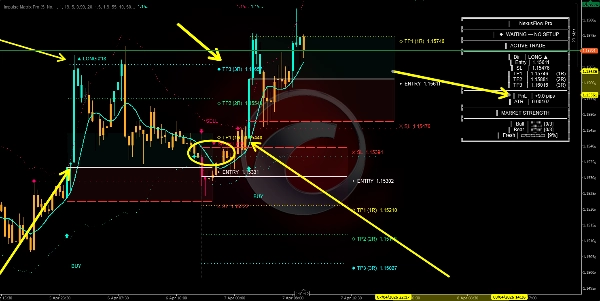
Description
Impulse Matrix Pro 🚀
Qu'est-ce que c'est ?
https://chartshots.spotware.com/c/69d5282dc32e0
Impulse Matrix Pro est un indicateur superposé qui génère des signaux d'achat et de vente 📈📉 uniquement lorsque trois moteurs indépendants sont d'accord simultanément. Il combine la détection de tendance, les cassures d'impulsion et des filtres intelligents en un système confluent unique avec des niveaux intégrés de gestion des risques 🛡️.
https://chartshots.spotware.com/c/69d5293d873fa
Les Trois Moteurs ⚙️
https://chartshots.spotware.com/c/69d5288a347ea
Moteur 1 — Tendance (SMEMA) 🌊
Une moyenne mobile doublement lissée (exponentielle → puis simple) crée la Ligne Nexus.
- Si elle monte → la tendance est haussière 🟢.
- Si elle descend → baissière 🔴.
Autour d'elle, 3 bandes enveloppes sont tracées au-dessus et en dessous, espacées par la plage moyenne lissée des chandeliers. La position du prix par rapport à ces bandes détermine la force (0–3) :
Force
Signification
1/3
Prix au-delà de la Bande 1
2/3
Prix au-delà de la Bande 2
3/3
Prix au-delà de la Bande 3 ⚡
Force minimale plus élevée = moins de signaux mais de meilleure qualité
Moteur 2 — Impulsion (BOSWaves)
Détecte les événements de cassure de structure en utilisant des bandes dynamiques construites à partir de :
- Une ligne de base EMA
- La déviation absolue moyenne (MAD) comme unité de volatilité
Comportement clé : Les bandes se contractent après des mouvements forts (plus facile à déclencher) et s'élargissent pendant la consolidation (plus difficile à déclencher). Ceci est contrôlé par un score de fraîcheur de l'impulsion qui décroît avec le temps ⏳.
- Cassure haussière : Clôture précédente ≤ bande supérieure, clôture actuelle la franchit à la hausse 🚀.
- Cassure baissière : Clôture précédente ≥ bande inférieure, clôture actuelle la franchit à la baisse 📉.
Moteur 3 — Filtres Intelligents 🛡️
Trois filtres que chaque signal doit franchir :
- Volatilité ATR : Le marché a suffisamment de mouvement pour trader 🌊
- Momentum : Le prix évolue effectivement dans la direction du signal sur N barres 🏃♂️
- Fraîcheur : L'impulsion n'a pas décayé — le mouvement est toujours "vivant" 🔥
Conditions du Signal 🚦
ACHAT — Les 7 conditions doivent être vraies : ✅
- Ligne Nexus en hausse
- Force haussière ≥ seuil minimum
- Cassure haussière d'impulsion détectée
- Direction passée de baissière à haussière
- Filtre ATR passé
- Momentum confirme le mouvement vers le haut
- Fraîcheur de l'impulsion au-dessus du seuil
VENTE — Les 7 conditions doivent être vraies : ✅
- Ligne Nexus en baisse
- Force baissière ≥ seuil minimum
- Cassure baissière d'impulsion détectée
- Direction passée de haussière à baissière
- Filtre ATR passé
- Momentum confirme le mouvement vers le bas
- Fraîcheur de l'impulsion au-dessus du seuil
Note : Si une seule condition échoue → pas de signal ❌.
Logique Stop Loss & Take Profit 📏
Tous les niveaux sont basés sur l'ATR et entièrement adaptatifs à la volatilité actuelle 🔄.
- Distance Stop Loss = ATR × Multiplicateur SL (par défaut 1.5)
Niveau
Calcul
R:R par défaut
SL
Entrée ∓ (ATR × 1.5)
— 🛑
TP1
Entrée ± (distance SL × 1.0)
1:1 🎯
TP2
Entrée ± (distance SL × 2.0)
1:2 🎯🎯
TP3
Entrée ± (distance SL × 3.0)
1:3 💰
Marchés volatils → stops et objectifs plus larges. Marchés calmes → niveaux plus serrés. Tout s'adapte automatiquement ⚖️.
Éléments Visuels 🎨
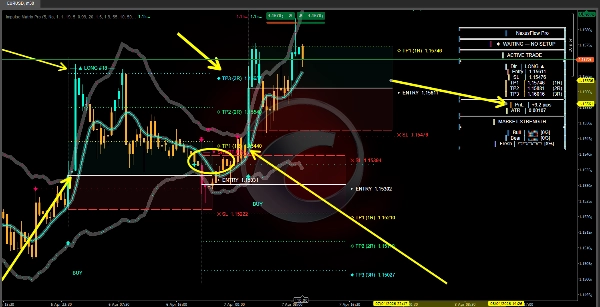
- Ligne Nexus : Direction centrale de la tendance 🧵
- Bandes Enveloppes : Zones de mesure de la force avec remplissage en dégradé 📊
- Bandes d'Impulsion (pointillées) : Seuils dynamiques de cassure 🏁
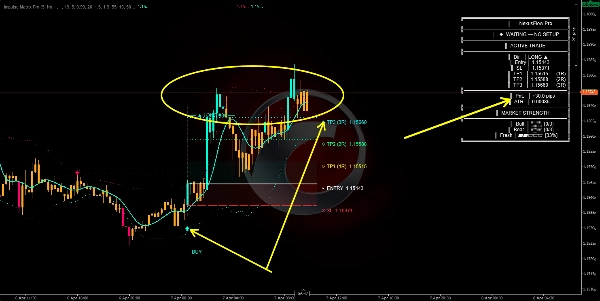
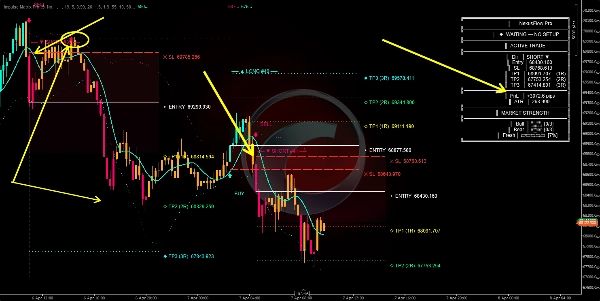
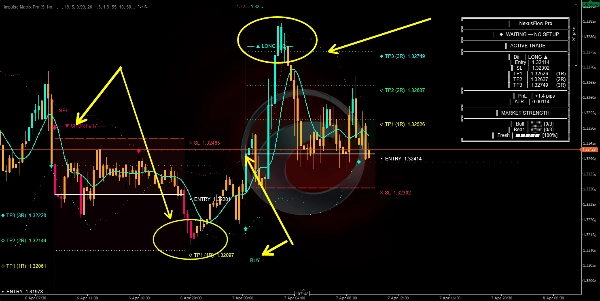
- Flèches ACHAT / VENTE : Signaux d'entrée confirmés 🏹
- Diamants Blancs : Points de retournement sur la Ligne Nexus 💎
- Lignes Entrée / SL / TP : Niveaux de trade projetés 📐
- Zone Rouge : Zone de risque (Entrée à SL) ⚠️
- Zone Verte/Cyan : Zone de récompense (Entrée à TP1) 🏆
- Étoiles + Lignes Horizontales : Signaux de retest — le prix revisite la bande d'impulsion sans la casser ⭐
- Nuage de Tendance : Ombre subtile en arrière-plan montrant la direction dominante ☁️
- Couleurs des Barres : Cyan = haussier · Rose = baissier · Orange = pas de configuration 🎨
- Panneau d'Info (en haut à droite) : Données de trade en direct, PnL, jauges de force, indicateur de fraîcheur 🖥️
Comment Utiliser 📖
- Attendez une flèche ACHAT/VENTE 🏹 — les barres orange signifient pas de configuration, restez à l'écart 🛑.
- Vérifiez le panneau 🖥️ — plus de force et de fraîcheur = plus de conviction.
- Tradez les niveaux projetés 📏 — SL là où indiqué, prenez des parts partielles à TP1/TP2, laissez le reste courir jusqu'à TP3.
- Retestez les étoiles ⭐ peuvent être utilisées comme opportunités supplémentaires sur une position existante.
- Signal opposé 🔄 = le trade précédent est conceptuellement invalidé.
Paramètres Clés ⚙️
Paramètre
Valeur Plus Élevée
Valeur Plus Basse
Période du Cycle
Tendance plus lissée, signaux plus lents
Plus rapide, plus réactif ⚡
Force Min
Moins de signaux, filtre plus strict
Plus de signaux, moins de filtrage 🔍
Longueur EMA de la Tendance
Base d'impulsion plus lissée
Cassures plus réactives 🌊
Multiplicateurs de Bandes
Bandes d'impulsion plus larges, moins de cassures
Bandes plus étroites, plus de cassures 📏
Seuil ATR
Nécessite une volatilité plus forte 🌪️
Permet des signaux à faible volatilité
Seuil de Fraîcheur
Seules les impulsions fraîches sont qualifiées 🔥
Permet les impulsions décadentes
Multiplicateur SL
Stop loss plus large 🛡️
Stop loss plus serré 🎯
Ratios TP
Objectifs plus ambitieux 💰
Objectifs plus conservateurs
Avertissement ⚠️
Cet indicateur n'exécute pas les trades. C'est un outil analytique 🧠. Les niveaux TP/SL sont des suggestions basées sur la volatilité, pas des garanties de prix. Il fonctionne mieux dans des conditions de tendance 📈. À combiner avec l'analyse de la structure du marché et une gestion appropriée des risques.
Résumé
The three engines include:
1. Trend (SMEMA) – uses a double-smoothed moving average called the Nexus Line to determine bullish or bearish trends and measures price strength via three envelope bands.
2. Impulse (BOSWaves) – detects break-of-structure events using dynamic bands derived from an EMA baseline and volatility measured by Mean Absolute Deviation, with an impulse freshness score that decays over time.
3. Smart Filters – apply volatility, momentum, and freshness criteria to validate signals.
Signals require all seven conditions per direction (buy or sell) to be met, ensuring confirmation from trend, strength, breakout, momentum, and volatility filters. Stop loss and take profit levels are ATR-based and automatically adjust to market volatility, supporting risk management with multiple target ratios.
Visual elements include trend lines, envelope and impulse bands, entry/exit markers, zones indicating risk and reward, and an info panel displaying live trade data. The indicator supports markets such as Forex, indices, stocks, and cryptocurrencies. It is designed for trending conditions and serves as an analytical tool without executing trades.
Discussion
Avis clients
5 | 100 % | |
4 | 0 % | |
3 | 0 % | |
2 | 0 % | |
1 | 0 % |





























