"Zones Supply Demand" logo
Zones Supply Demand
3.5
Reviews: 2
"Zones Supply Demand" uploaded image
Since 03/10/2024
143
Sales
32.41K
Free installs

Pinescriptlabs Store indicators:                        Pinescriptlabs  Store cBots :  (cBot) Gold & BTC BreakoutSession Pivots(new)


Advanced Market Structure: Bos, Choch, SwinLevels, Order Blocks,  Market Structure & Liquidity Finder (New)

ZigZag Price Liquidity Projection

Trailing Smart Algorithm (new)

S&R Structural ZigZag                                

ZigZag

 BOS & CHOCH

Zones Supply Demand

Leverage Liquidation Map

Auto-Trend Channel


Volume POC Heatmap


PREMIUM SSL CHANNEL

Prediction Based on Linreg & ATR

 ICT Power of 3 
                                                   

SmartTrend Support &
Resistance
Lines
       

Fair Value Gap Sessions                


RSI Trend Trigger

Channel Breakout System

Supertrend

Market Imbalance

Adaptive Trend Channel 

Dynamic
Market Structure
Analysis
of
Turning
Points

Order Block

Fibonacci
Linear
Regression
Multi-timeframe

Dynamic RSI

Momentum Fair Value Gap

Market Flow Projection

Dynamic Trend Gradient

Multi-Level
Candle Bias
Tracker

Zig-Zag Extremity Tracker

Reactive Moving Average

Auto
Support and
Resistance
Trend
Lines

All
Support and
Resistance
Levels

Dynamic Range Momentum

Zones Supply & Demand


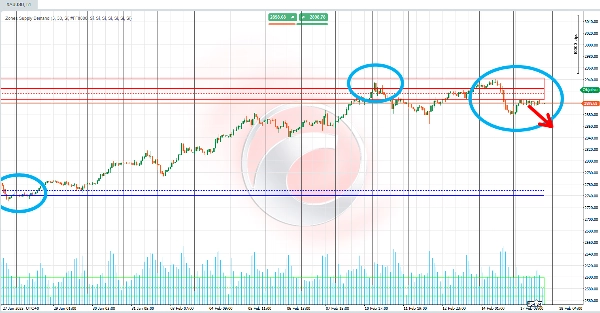
The algorithm analyzes price action through volume accumulation, dividing the visible price range (from high to low) into multiple segments or "intervals." πŸ“ For each interval, it calculates the generated volume and compares it to a predetermined threshold percentage. The goal? To identify levels where volume concentration is so high that it signals a Supply Zone or Demand Zone! 🎯

πŸ“‰ For the Supply Zone:

  1. Start from the highest price and move downward through intervals.
  2. Accumulate volume in each segment.
  3. When accumulated volume exceeds the threshold, it marks a Supply Zone πŸš¨.
  4. A colored area (rectangle with specific opacity) is plotted from this level to the high, along with horizontal lines showing simple & weighted averages of prices in this zone. πŸ–οΈ

πŸ“ˆ For the Demand Zone:

  1. Start from the lowest price and move upward through intervals.
  2. Accumulate volume in each segment.
  3. When accumulated volume crosses the threshold, it defines a Demand Zone πŸš¨.
  4. A corresponding area is drawn, along with average lines to highlight the mean concentration level. πŸ–ŒοΈ

βš–οΈ Market Balance:
When both Supply and Demand Zones are identified, the algorithm calculates a Market Balance Point! 🌟 This equilibrium is derived from the average (simple or volume-weighted) between the two zones. The result? Clear reference lines on the chart showing the balance between buying and selling pressure! βš–οΈβœ¨

βœ… In Summary:
The "Zones Supply & Demand" indicator uses volume-based price segmentation to detect key areas of order concentration. πŸ—οΈ It then generates visual cues (colored zones, average lines, and balance points) to highlight critical levels on the chart, empowering traders to spot supply-demand imbalances and potential turning points! πŸš€πŸ’‘


Indicator profile
3.5
Reviews: 2
5
0 %
4
50 %
3
50 %
2
0 %
1
0 %
Customer reviews
July 9, 2025
Pros: Automatically detects supply and demand zones. Clear visualization, customizable sensitivity. Stable performance on all assets. Cons: No alerts on zone entry/exit. No zone transparency adjustment. Lacks historical zone tracking and tooltip details.
May 4, 2025
it's very nice tbh ! Thank sir.
BTCUSD
Breakout
RSI
ATR
Commodities
Supertrend
Crypto
XAUUSD
Products available through cTrader Store, including trading bots, indicators and plugins, are provided by third-party developers and made available for informational and technical access purposes only. cTrader Store is not a broker and does not provide investment advice, personal recommendations or any guarantee of future performance.

More from this author

ZigZag filters noise, spots trends, patterns, pivots, aiding analysis, trade management, and confirmations. πŸ“‰πŸ“ˆ
Identify bullish and bearish Order Blocks to spot key support/resistance levels and potential trend reversals! πŸ“ˆπŸ”„
πŸ“Š Shows volume by price levels, highlights POC, and key zones. Identifies dynamic support/resistance and imbalances.
Market structural patterns , specifically the concepts of Change of Character (ChoCH) πŸ”„ and Break of Structure (BoS) πŸ’₯
Adaptive trend channel using linear regression and Pearson correlation for dynamic support, resistance, and trends.
"Identify key market zones and visualize support/resistance from multiple timeframes on a single chart.
identify and highlight temporary market inefficiencies known as "fair value gaps" 🚨 within specific trading Sessions.
πŸ’Ή Define a price channel πŸ“ˆ and determine trend direction (bullish 🟒 or bearish πŸ”΄).
Detects bullish and bearish divergences
Identify market structure effortlessly with swing highs, lows, CHoCH, and BOS levels for smart trading decisions! πŸ“ŠπŸ”"
πŸ” Automatically detect support and resistance levels based on "swings" or pivots
Advanced price action toolΒ that combines multiple technical analysis concepts

You may also like

SmartSignal Pro: Precise BUY/SELL signals to profit in any market. Trade like a pro! πŸš€
All-in-one suite for ICT concepts: NY Midnight Open, Killzones, automatic Liquidity levels (PDH/L, PWH/L).
RCS: 8 majors! AUD,USD,EUR,JPY,GBP,CAD,CHF,NZD. Find how strong each currency is relatively and trade smarter!
Deep Mood Distribution (DMD) is a segmented volume-profile and sentiment tool that analyzes price action in fixed bar bl
πŸš€ True Trend HTF PRO Trade with the dominant trend. Avoid low-quality setups. Stop second-guessing.
Identifies market compression zones and explosive Breakout moments using mathematical modeling.
Block Liquidity,indicator.Block Order, Liquids Stops, Signal Sentiment,signal correction.
Advanced MA crossover indicator. All MA types supported. Clear signals with customizable arrows Perfect for all trader
Advanced Pro Volume Profile: Double Back-to-Back, Institutional Dynamic, Fixed Range & Order Flow
Camarilla by Bullitt Traders β€” a precise, non-repainting pivot indicator for cTrader.
Larry Williams 9.1
multi time frame moving averge. you could choose different type of price like median ,high and ... and differnt type of
One of the best indicators we have ever developed, with a very high profit ratio.
Detects valid Fair Value Gaps from strong 3-bar patterns. Keep drawing unfilled gaps until price fills them.
uses HTF 1hr,4hr, 1D to check for valid directions enjoy
Custom Vwap Indicator
this indicator show other time frame close in lower time frame. for ex: show daily close in m 15.
Enhance the trading experience with real-time Spread, Time To Close, rPNL, uPNL, PNL and minimalistic Bid / Ask lines
Since 03/10/2024
143
Sales
32.41K
Free installs