
Description
Pinescritlabs Ctrader Store indicators :
Dynamic Market Structure
Analysis of Turning Points
Fibonacci Linear
Regression Multi-timeframe
Multi-Level Candle Bias
Tracker
Auto Support and
Resistance Trend Lines
All Support and
Resistance Levels
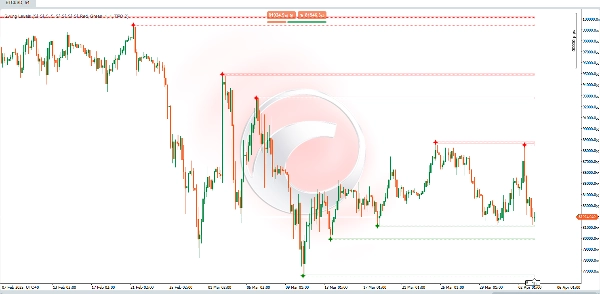
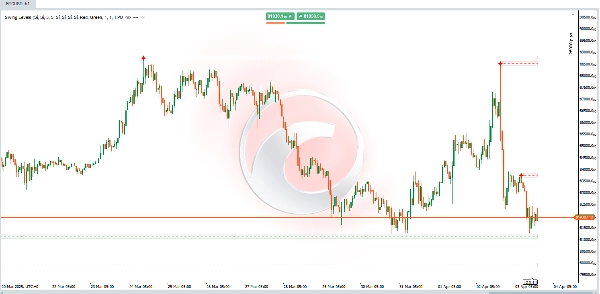
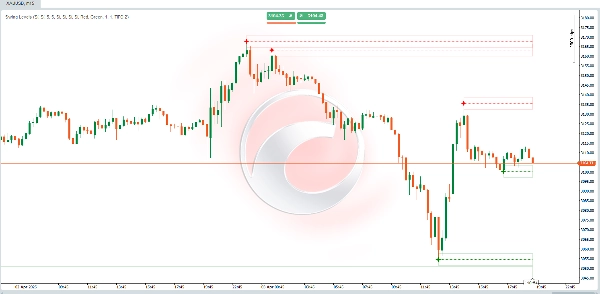
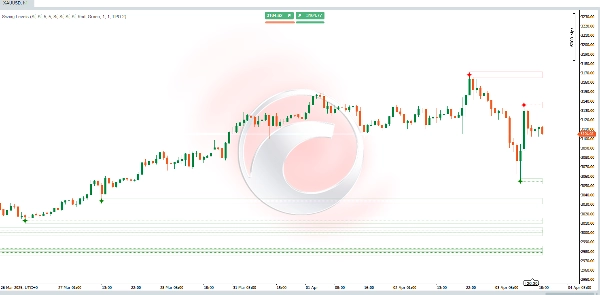
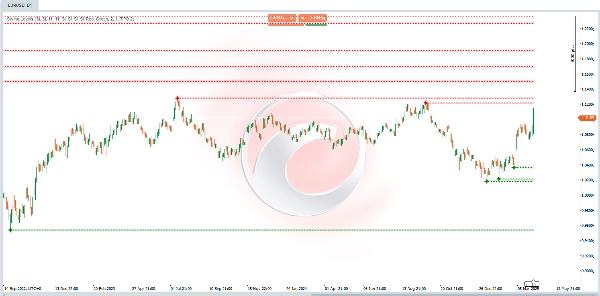
🔍 Swing Levels
This indicator is designed to automatically detect support and resistance levels based on "swings" or pivots in the chart (i.e., significant highs and lows). Once these points are identified, it draws lines or zones (rectangles) that serve as key references for price action and trading decisions.
🛠 Key Features:
✅ Identification of Key Levels: It highlights where the latest swing highs and swing lows have formed. These levels often act as support or resistance in the future.
✅ Market Structure Analysis: Helps visualize whether the market is forming higher highs and higher lows (bullish) or lower highs and lower lows (bearish)—essential for trend identification and potential reversal points.
✅ Decision-Making Tool: Traders can use these levels to determine entry points, stop-loss placements, or take-profit zones, leveraging dynamic support and resistance.
🧠 How Does It Work?
1️⃣ Pivot Detection (Swing High & Swing Low)
📌 The indicator analyzes a defined number of candles/bars to the left and right (parameters: "Left Bars" & "Right Bars").
📌 To detect a Swing High, it checks if the high of the central bar (potential pivot) is higher than the highs of the neighboring bars within the range.
📌 To detect a Swing Low, it applies the same logic but comparing the lows instead.
📊 Interpreting the Drawn Levels:
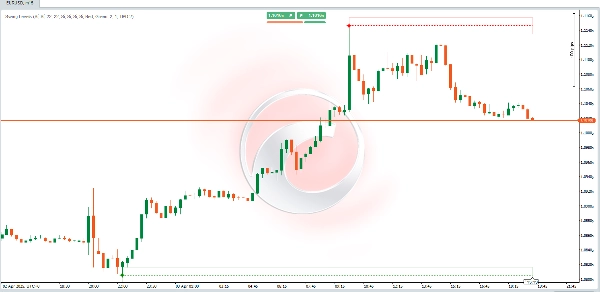
🔴 Swing Highs → Potential Resistance Zones:
- If the price returns to this level, watch for rejection (selling) or a breakout (bullish continuation).
🟢 Swing Lows → Potential Support Zones:
- If the price revisits this level, observe for a bounce (buying) or a breakdown (bearish continuation).
Summary
Key features include:
- Identification of recent swing highs and lows, which often act as future support or resistance.
- Visualization of market structure by highlighting patterns of higher highs and lows (bullish) or lower highs and lows (bearish), aiding trend recognition and reversal detection.
- A decision-making tool for traders to set entry points, stop-losses, and take-profit zones based on dynamic support and resistance.
Swing highs indicate potential resistance zones where price may reject or break out, while swing lows indicate potential support zones where price may bounce or break down. This indicator supports analysis across various markets and timeframes by providing clear visual cues of market turning points.
Customer reviews
5 | 0 % | |
4 | 100 % | |
3 | 0 % | |
2 | 0 % | |
1 | 0 % |


!["[Stellar Strategies] Ultimate Trend & Momentum Dashboard" logo](https://cdn.ctrader.com/image/webp/e9a9c9e9-4b6c-4bc0-9988-4c4768a23b6c_30290)


!["[Stellar Strategies] MARSI Signal Plotter" logo](https://cdn.ctrader.com/image/webp/7b2b8da6-8f8e-4646-8d4a-4710c516c01e_25567)


