
HeatMap Candle
Indicator
138 downloads
Version 1.0, Apr 2025
Windows, Mac
Description
HeatMap Candle
Summary
AI summary
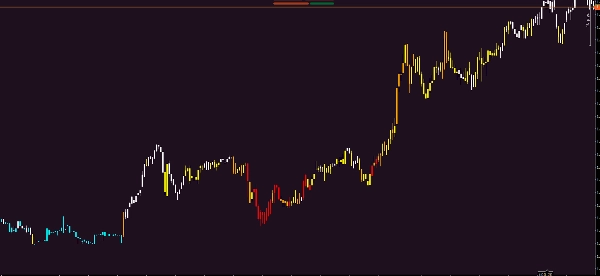
HeatMap Candle is a trading indicator designed to visually represent market data using a heatmap-style candle chart. It provides a graphical display that highlights price movements and intensity within candlestick patterns, aiding traders in analyzing market conditions. The indicator focuses on enhancing the interpretation of price action through color-coded heatmap visualization, which can help identify trends and potential turning points. It is suitable for integration into trading platforms that support custom indicators.
Indicator profile
Customer reviews
0.0
Reviews: 0
Customer reviews
No reviews for this product yet. Already tried it? Be the first to tell others!
Discussion
FAQ
Products available through cTrader Store, including trading bots, indicators and plugins, are provided by third-party developers and made available for informational and technical access purposes only. cTrader Store is not a broker and does not provide investment advice, personal recommendations or any guarantee of future performance.
More from this author


!["Tabajara corrigido[fix]" logo](https://cdn.ctrader.com/image/webp/7f4bbef8-b245-4ebd-80d7-582fffc0c90c_28378)


Price
Since 10/02/2025
1.25K
Free installs