Description
MoneyMasters - HTF Bars Indicator
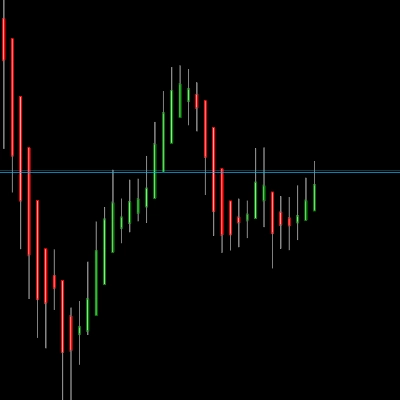
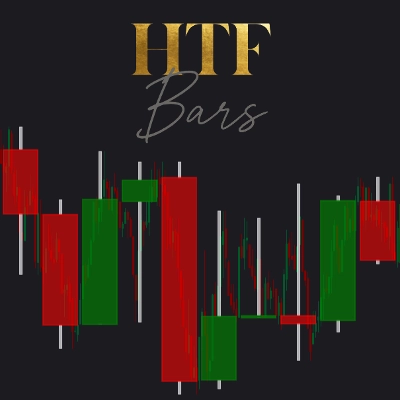
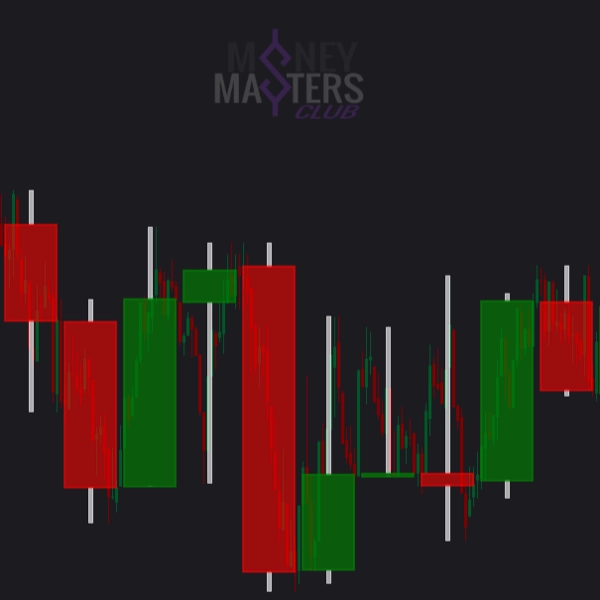
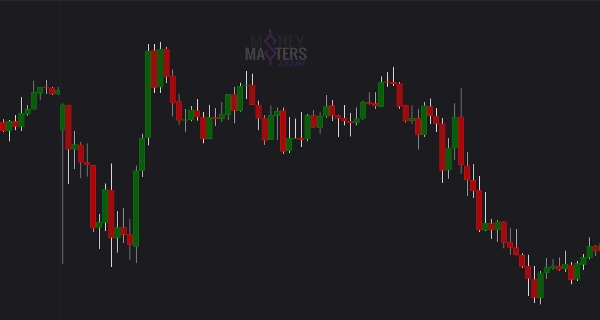
Elevate your trading experience with the MM-HTF Bars Indicator, a powerful tool designed for cTrader that seamlessly overlays higher timeframe (HTF) candlestick data onto your current chart. This indicator provides a clear visual representation of HTF price action, helping you make more informed trading decisions by combining multiple timeframes in one view.
Key Features:
- Customizable Timeframe: Choose the higher timeframe (e.g., 15 minutes, 1 hour) to display directly on your chart.
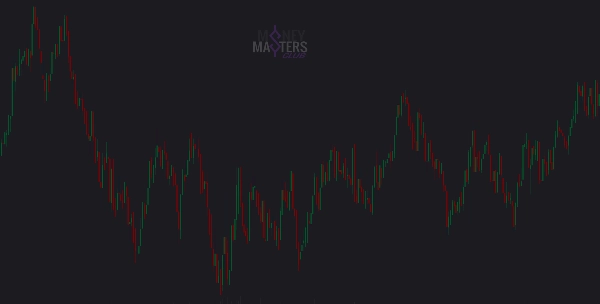
- Dynamic Zoom Control: Automatically hide or show HTF and lower timeframe (LTF) bars based on your chart's zoom level for a clutter-free experience.
- Color-Coded Candlesticks: Easily distinguish between bullish and bearish HTF candles with customizable body and wick colors.
- Precise Visualization: Displays HTF open, high, low, and close levels with accurate alignment to your chart's timeline.
- Seamless Integration: Works as an overlay, ensuring your chart remains clean and easy to read.
Benefits:
- Gain a deeper understanding of market trends by analyzing HTF price action alongside LTF data.
- Improve your trading strategy by identifying key HTF support and resistance levels.
- Save time and effort by eliminating the need to switch between multiple charts.
Whether you're a scalper, day trader, or swing trader, the MM-HTF Bars Indicator is an essential tool to enhance your market analysis and decision-making process.
Start trading smarter today!
----------
Update 1.02 / 25041201:
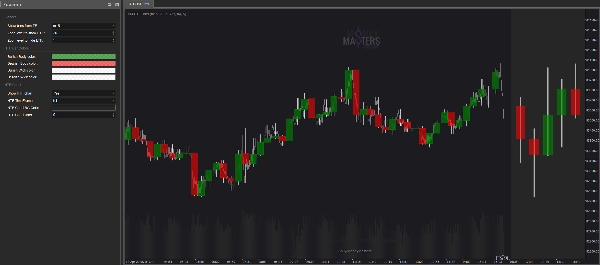
- HTF MINI CHART - now shows mini chart on the right side with HTF candles. You can choose a different TimeFrame and number of candles to show.
----------
Update 1.01 / 25040901:
- Smoother work - now indicator is updated on Zoom change, not on tick.
- Indicator can change candles on pause in Market Reply.
Summary
Discussion
Customer reviews
5 | 50 % | |
4 | 50 % | |
3 | 0 % | |
2 | 0 % | |
1 | 0 % |