
Descrizione
📈 PineScriptLabs Smart Signals CDRC [Auto TP/SL]
❓ Cos'è questo indicatore?
Il sistema Dynamic Close Range Channels (CDRC) è un indicatore sviluppato secondo la teoria di PineScriptLabs che utilizza due canali indipendenti per generare segnali di acquisto/vendita 📊 e calcolare automaticamente obiettivi di profitto dinamici (TP) e stop loss (SL) 🎯 che sono mai uguali.
🎯 Algoritmo Speciale Dinamico TP/SL ⚡
A differenza dei sistemi che utilizzano livelli fissi o ATR, questo algoritmo calcola TP e SL basati sul movimento reale del prezzo dall'ultimo segnale:
• Per LONG 📈: Misura la distanza dal prezzo più basso registrato all'ingresso, calcola la percentuale di quel movimento, e proietta quella stessa percentuale verso l'alto per stabilire gli obiettivi
• Per SHORT 📉: Misura la distanza dal prezzo più alto registrato all'ingresso, e proietta quella percentuale verso il basso
🎯 Ciò significa che ogni operazione ha livelli unici adattati al contesto di mercato specifico in quel momento, riflettendo il vero slancio prima del segnale 💡
📊 La Teoria CDRC: Costruzione del Canale 🏗️
Fondamenti Tecnici 🔍
La teoria CDRC costruisce canali basati esclusivamente sugli intervalli di prezzo di chiusura, non sulla volatilità o deviazione standard. Le chiusure rappresentano il vero consenso di mercato e eliminano il rumore delle ombre 🎯
Processo di Costruzione ⚙️
- Prezzo Medio: Media di tutte le chiusure del periodo
- Intervallo: Differenza tra la chiusura più alta e quella più bassa del periodo
- Ampiezza: Intervallo × Moltiplicatore ÷ 2
- Bande:
o Superiore = Prezzo Medio + Ampiezza ↗️
o Inferiore = Prezzo Medio - Ampiezza ↘️
🔄 I canali vengono ricalcolati ad ogni barra, adattandosi costantemente al mercato
⚙️ Come funziona?
Due Canali Simultanei 📊📊
• Canale 1 (Veloce - 111 barre): Reagisce rapidamente ai cambiamenti, moltiplicatore 0.14 ⚡
• Canale 2 (Lento - 388 barre): Visione a lungo termine, moltiplicatore 0.11 🐢
Generazione Segnali 🎯
• LONG ✅: Il prezzo chiude sopra la banda superiore di ENTRAMBI i canali per 2 barre consecutive 🟢
• SHORT ✅: Il prezzo chiude sotto la banda inferiore di ENTRAMBI i canali per 2 barre consecutive 🔴
🛡️ La doppia conferma filtra i falsi segnali
🤖 Calcolo Automatico TP/SL (Dettaglio Algoritmo)
Per LONG 📈:
- Il sistema registra continuamente il prezzo più basso dall'ultimo segnale
- Quando genera il segnale di acquisto, calcola: Percentuale = (Ingresso - Minimo) / Ingresso × 100
- Proietta quella percentuale verso l'alto dall'ingresso per stabilire TP3
- Divide l'intervallo in tre zone: TP1 (33%), TP2 (66%), TP3 (100%)
- SL = Ingresso - (Ingresso × Percentuale × Rapporto Stop Loss / 100)
Per SHORT 📉:
- Il sistema registra continuamente il prezzo più alto dall'ultimo segnale
- Quando genera il segnale di vendita, calcola: Percentuale = (Massimo - Ingresso) / Ingresso × 100
- Proietta quella percentuale verso il basso dall'ingresso per stabilire TP3
- Divide l'intervallo in tre zone progressive
- SL = Ingresso + (Ingresso × Percentuale × Rapporto Stop Loss / 100)
🎯 Risultato: Ogni operazione ha livelli unici calcolati in base allo slancio specifico del mercato in quel momento
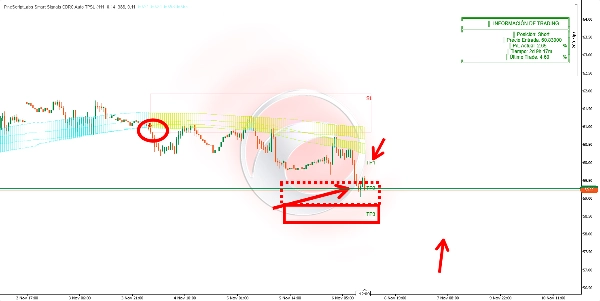
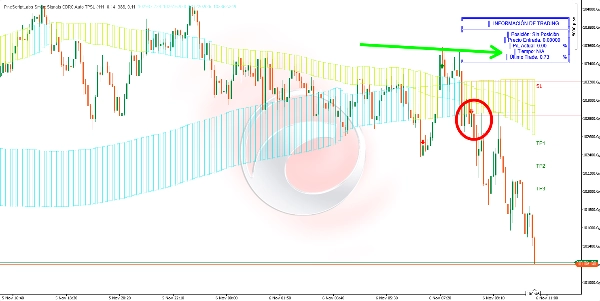
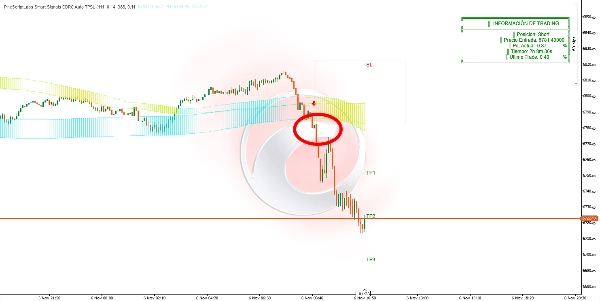
👀 Visualizzazione 🎨
• Punti: Bande di entrambi i canali
• Riempimento dinamico: I canali cambiano colore quando vengono penetrati
• Riquadri: Zona di ingresso (SL-Ingresso) e tre zone target (trasparenze progressive)
• Etichette: SL, TP1, TP2, TP3 con prezzi esatti 🏷️
• Frecce: Verde (acquisto) 🟢 / Rosso (vendita) 🔴
• Tabella: Posizione attuale, prezzo di ingresso, P/L % corrente, tempo in operazione, ultima operazione chiusa 📋
🎯 A cosa serve?
- Ingressi ad alta probabilità con conferma su due timeframe ✅
- Gestione automatica del rischio adattiva basata sul movimento reale del mercato 🤖
- Obiettivi unici e sfalsati per ogni operazione secondo lo slancio precedente 🎯
- Adattamento dinamico al comportamento recente del prezzo 🔄
- Monitoraggio in tempo reale delle performance della posizione 📊
🛠️ Come usarlo?
Ingresso 🚀: Entra alla chiusura della barra quando appare la freccia
Gestione 💼:
• TP1: 33% del movimento previsto (profitti parziali) 💰
• TP2: 66% del movimento (più profitti) 💰💰
• TP3: 100% del movimento (obiettivo finale) 🎯
• SL: Rispetta sempre lo stop loss automatico ⛔
Monitoraggio 👀: La tabella mostra il P/L corrente in tempo reale. Il sistema rileva automaticamente quando TP3 o SL vengono raggiunti. Solo un segnale attivo alla volta ⚠️
⚙️ Parametri e Impatto
Periodo Canale 1 (111):
• ↑ Più barre = Meno segnali, più affidabile, più lento 🐢
• ↓ Meno barre = Più segnali, più veloce, più sensibile ⚡
Moltiplicatore Canale 1 (0.14):
• ↑ Più alto = Bande larghe, meno segnali, solo movimenti forti 💪
• ↓ Più basso = Bande strette, più segnali, maggiore sensibilità 🎯
Periodo Canale 2 (388):
• ↑ Più alto = Conferma rigorosa, meno segnali 🛡️
• ↓ Più basso = Più segnali, meno filtraggio 📊
Moltiplicatore Canale 2 (0.11):
• ↑ Più alto = Filtraggio rigoroso, conservativo 🎯
• ↓ Più basso = Maggiore sensibilità, più operazioni ⚡
Rapporto Stop Loss (50%):
• 50% = Rapporto 1:2 (bilanciamento professionale: rischio 1, profitto 2) ⚖️
• ↑ Verso 100% = SL ampio, più rischio, meno stop out, peggior R:R 📉
• ↓ Verso 1% = SL stretto, meno rischio, miglior R:R, più stop out 📈
🔑 Considerazioni Chiave
• Memoria del mercato 🧠: Registra gli estremi di prezzo dall'ultimo segnale per proiezioni realistiche e uniche
• TP/SL mai uguali ⚖️: Ogni operazione ha livelli calcolati secondo il suo contesto specifico
• Conferma doppia obbligatoria per 2 barre consecutive ✅✅
• Solo un segnale attivo alla volta ⚠️
• I canali si ricalcolano costantemente adattandosi al mercato 🔄
• I riquadri si estendono visivamente per mantenere la visibilità 👀
🚀 Oltre 10.000 trader usano già i nostri migliori indicatori🏆
👉 Ottieni tutti i nostri migliori sistemi qui:
_______________________________________________
📌 Indicatori di Struttura di Mercato
· ✅ AdvancedMarket Structure: Bos, Choch, SwinLevels, Order Blocks, Market Structure& Liquidity Finder
· 🔄 Dynamic Market StructureAnalysis of Turning Points
· 🧱 Order Block
· ⚖️ Market Imbalance
· ⛓️ BOS & CHOCH
· 🧠 ICT Power of 3
_______________________________________________
🔚 Sistemi di Uscita Intelligenti
_______________________________________________
📐 Indicatori ZigZag
· 🔍 ZigZag Price LiquidityProjection
· ➖ ZigZag
_______________________________________________
🧱 Indicatori di Supporto e Resistenza
· 🟩 SmartTrend Support &Resistance Lines
· 🧱 All Support and ResistanceLevels
_______________________________________________
📊 Indicatori di Trend e Canale
· 📊 Supertrend
_______________________________________________
💧 Strumenti di Volume e Liquidità
_______________________________________________
⚡ Indicatori di Momentum e RSI
· 🔎 Multi-Level Candle Bias
Tracker
_______________________________________________
🔮 Strumenti di Predizione e Proiezione
· 📐 Prediction Based on Linreg& ATR
· 📏 Fibonacci Linear RegressionMulti-timeframe
· 📈 Volume-Powered Market Flow Projector
Riepilogo
Recensioni dei clienti
5 | 67 % | |
4 | 0 % | |
3 | 33 % | |
2 | 0 % | |
1 | 0 % |


![Logo di "[Hamster-Coder] Bollinger Bands"](https://cdn.ctrader.com/image/webp/21d8e5d6-fb11-4bac-b9ee-cd05c2b76804_30327)
