
FX Sniper
Indicator
5 purchases
Version 2.0, Dec 2025
Windows, Mac
4.6
Reviews: 3
Description
FX Sniper: Advanced Filtering for Major Currency Pairs
- FX Sniper is a specialized technical analysis tool designed for the Forex market (Major Pairs like EURUSD, GBPUSD, USDJPY). Unlike the Index Hunter (which chases volatility), FX Sniper is built for precision and filtering, helping you avoid "whipsaw" markets by confirming trends across multiple timeframes before signaling.
- 1. Core Mechanics
- A. "Dampened" Vector Forecast
- Forex pairs are noisier than indices. FX Sniper uses a modified slope algorithm with a "Dampening Factor" (0.8x coefficient).
- What it does: It intentionally reduces sensitivity to minor price spikes.
- Visual: It draws a 4-point forecast line (Cyan -> Yellow -> Orange) that projects price 4 candles into the future.
- Difference from Index Hunter: The forecast curve is "heavier" and smoother, filtering out market noise to show the true institutional flow.
- B. Multi-Timeframe Alignment (The "Sniper Scope")
- It doesn't trust a single timeframe. The "Sniper" logic requires alignment:
- Macro Trend: Checks the H1 and H4 slope.
- Micro Momentum: Checks M5 and M15 slope.
- Signal: It only generates a "Bull" or "Bear" bias when these timeframes agree, reducing false signals in ranging markets.
- C. Rolling Pivot System (H12 / 48h / 72h)
- Standard daily pivots often fail in 24/5 Forex markets. FX Sniper introduces "Rolling Structures":
- Flexible Timeframes: You can set pivots to calculate based on the last 12 Hours, 48 Hours (2 Days), or 72 Hours (3 Days).
- Usage: This helps identify significant multi-day structural levels that algorithms respond to, rather than just the arbitrary "midnight" reset level.
- D. Account Protection ("Margin Awareness")
- Pip Value Calculator: Automatically detects if you are trading a Cross-pair (e.g., GBPJPY) vs. a Major (EURUSD) and adjusts risk calculations.
- Endurance Metric: Displays your "Survivability" in pips.
- Shield ON: Green status means your free margin can withstand significant volatility (standard deviation moves).
- Shield OFF: Red warning if your leverage is too high for the current pair's volatility.
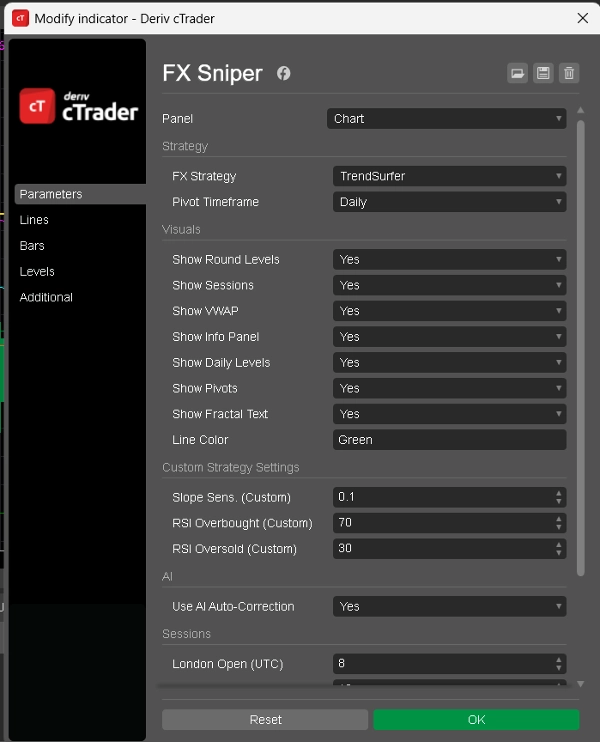
- 2. Available Modes (Strategies)
- You can switch the
Fx Strategy- parameter to change the bot's behavior:
- 1. Mode: TrendSurfer (Trend Following)
- Best For: Catching the "Big Move" of the day (London/NY Overlap).
- Logic:
- 2. Mode: RangeBound (Mean Reversion)
- Best For: Asian Session or choppy afternoons.
- Logic:
- Trigger: purely based on RSI extremes.
- Sell: RSI > 70 ("SELL TOP").
- Buy: RSI < 30 ("BUY BOTTOM").
- Philosophy: "Buy low, sell high." It assumes the market is stuck in a box and plays the edges.
- 3. Mode: KeyLevelSniper (Structure)
- Best For: Trading bounces off rigid levels.
- Logic:
- Trigger: Uses a simplified H1 Slope filter but validates it against the Pivot Level distance.
- Philosophy: Focuses on price action near the H12/Daily/Day2 pivots defined in your settings.
- 4. Mode: Custom (User Defined)
- Best For: Hybrid strategies.
- Logic:
- Allows you to combine Slope (Momentum) and RSI (Reversion) manually.
- Example: set
Slope Sens
to 0.1 andRSI Over
to 80 to create a "Super Extreme" reversal setup.
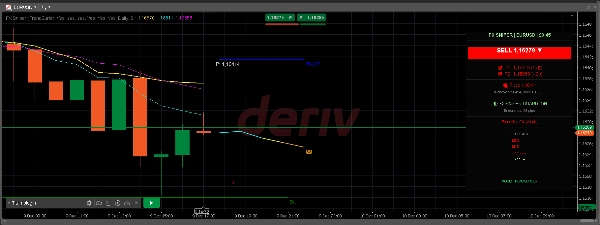
- 3. The Information Panel
The panel (top right) is your cockpit:
- Analysis Header: Displays current pair and the "Sniper" timestamp.
- Preference: "BUY" or "SELL" with a specific entry price.
- Targets (T1 / T2): Calculated based on ATR volatility (e.g., "T1: +20 pips").
- Feasibility Score:
- Strong (Lima): >80% probability (Trade aligns with H4 trend + Room to move).
- Fair (Yellow): 50-80% (Valid setup but maybe lower volatility).
- Weak (Red): Risk/Reward doesn't make sense (Target is too far relative to ATR).
- History: A "Win/Loss" track record of the last 10 signals generated by the bot in the current session (displayed as ✅ or ❌).
Summary
AI summary
FX Sniper is a technical analysis indicator designed for multi-pair Forex trading, focusing on major currency pairs such as EURUSD, GBPUSD, and USDJPY. It employs advanced filtering techniques to reduce market noise and avoid false signals by confirming trends across multiple timeframes before generating trade biases.
Key features include:
- A "Dampened" Vector Forecast that projects price movement four candles ahead using a modified slope algorithm with reduced sensitivity to minor price spikes.
- Multi-Timeframe Alignment ("Sniper Scope") that requires agreement between macro trends (H1 and H4 slopes) and micro momentum (M5 and M15 slopes) to signal bullish or bearish bias.
- A Rolling Pivot System offering flexible pivot calculations over 12, 48, or 72-hour periods to identify significant multi-day structural levels.
- Account Protection tools that automatically adjust risk calculations based on pair type and display margin endurance status.
FX Sniper supports four operational modes: TrendSurfer (trend following), RangeBound (mean reversion), KeyLevelSniper (structure-based trading), and a Custom mode allowing user-defined combinations of momentum and RSI parameters.
An integrated information panel provides real-time analysis, including trade preference, entry price, ATR-based targets, feasibility scores, and recent signal performance. This tool is intended to assist traders in making informed decisions by filtering out noise and confirming trend strength across timeframes.
Indicator profile
Customer reviews
4.6
Reviews: 3
5 | 67 % | |
4 | 33 % | |
3 | 0 % | |
2 | 0 % | |
1 | 0 % |
Customer reviews
December 22, 2025
FX Sniper is a fast momentum-based entry tool. Clean signals, lightweight and responsive, ideal for intraday timing. Best used as confirmation with structure and trend filters. Can be noisy on lower TFs, but filtering makes it effective.
December 19, 2025
The good surprise is the setup needs less second guessing. It is not the entire strategy.
December 19, 2025
Discussion
FAQ
Forex
Signal
Scalping
EURUSD
GBPUSD
NZDUSD
RSI
AI
ATR
Bollinger
USDJPY
VWAP
Products available through cTrader Store, including trading bots, indicators and plugins, are provided by third-party developers and made available for informational and technical access purposes only. cTrader Store is not a broker and does not provide investment advice, personal recommendations or any guarantee of future performance.


Price
Since 08/11/2025
23
Sales
59
Free installs