Description
📌 What the Indicator Does
MarketStructureOscSignals is a pure price-action signal tool.
It:
- Detects swing highs and swing lows using a left/right lookback.
- Tracks whether those swings are forming:
- Higher Highs + Higher Lows → Bullish structure
- Lower Highs + Lower Lows → Bearish structure
- When the structure switches:
- From bearish → bullish → it plots a BUY signal
- From bullish → bearish → it plots a SELL signal
So every signal represents a true change in market structure, not just a moving average crossover.
⚙️ Inputs & How to Set Them
1. Swing Left / Swing Right
These control how “strict” a swing high/low is.
- Swing Left (default 2)
Number of bars to the left of the swing that must have lower highs (for a swing high) or higher lows (for a swing low). - Swing Right (default 2)
Number of bars to the right that must also confirm the swing.
How to use:
- Small values (1–2):
- More swings, more signals
- Works well on higher timeframes (H1, H4, D1)
- Larger values (3–4+):
- Only major structural turns
- Fewer but stronger signals
- Good on lower timeframes to avoid noise
2. Min Bars Between Signals
Minimum number of bars that must pass between two signals.
- Avoids clustering of arrows on every tiny pullback.
- Example:
- Set to
3→ at least 3 bars between one signal and the next. - On very fast charts (M1–M5) you might want
5–10. - On H1 or higher,
2–3is usually enough.
- Set to
3. Arrow Offset (pips)
How far the arrow and label are placed from the candle (in pips).
- For Forex:
5–10pips usually looks good.
- For indices (US500, US100, etc.):
- Use a larger offset (e.g. 20–50 “pips” depending on broker pip size).
If the arrows overlap the candles, increase this value.
If they are too far away, decrease it.
4. Show BUY/SELL Text
true→ shows both an arrow (↑/↓) and the text “BUY” or “SELL”.false→ only arrows.
If the chart feels cluttered, you can hide the text and keep just the arrows.
🔍 How Signals Are Generated (Logic)
Internally the indicator:
- Keeps track of the two most recent swing highs and two most recent swing lows:
_prevHigh,_lastHigh_prevLow,_lastLow
- From these it checks:
- Are highs and lows both rising?
- → Bullish trend (
StructureTrendSignal.Bullish)
- → Bullish trend (
- Are highs and lows both falling?
- → Bearish trend (
StructureTrendSignal.Bearish)
- → Bearish trend (
- If they’re not aligned, the previous trend is kept.
- Every time the structural trend changes:
Bearish → Bullish→ BUY signalBullish → Bearish→ SELL signal
- It also ensures:
- Trend was not
Unknown(so not at the very beginning). - Enough bars have passed since the last signal (
MinBarsBetweenSignals).
- Trend was not
This means each arrow marks a true structural shift, not random noise.
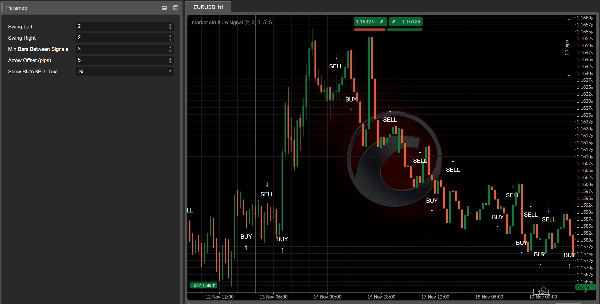
📈 How to Read BUY/SELL Signals on the Chart
✅ BUY Signal
What you see:
- An up arrow
↑under the candle - Optionally the text “BUY” near the arrow
What it means:
- Structure changed from bearish → bullish.
- Recent swing highs and lows are now both moving up.
- Market is likely transitioning into a new uptrend or resuming bullish structure.
How to use it:
- Look for long entries:
- On the signal candle or on the next few candles.
- Preferably after a small pullback to a support level (previous swing low, demand zone, VWAP, VA low, etc.).
- Use tools like Kalman Trend / EMA / Volume Profile to filter:
- Only take BUYs when higher timeframe or Kalman is also bullish.
✅ SELL Signal
What you see:
- A down arrow
↓above the candle - Optionally the text “SELL”
What it means:
- Structure changed from bullish → bearish.
- Swing highs and lows are now both moving down.
- Market is likely entering a downtrend or resuming bearish structure.
How to use it:
- Look for short entries:
- On the signal candle or on following candles near resistance.
- Ideal after a retest of a broken support (now resistance), VAH, supply zone, etc.
🎯 Practical Trading Uses
1. As a Standalone Entry Tool
Simple rule-set:
- Buy Setup
- Wait for a BUY arrow.
- Place a long order at/near the signal candle.
- Stop loss below recent swing low.
- Target previous swing high or a key resistance.
- Sell Setup
- Wait for a SELL arrow.
- Place a short order at/near the signal candle.
- Stop loss above recent swing high.
- Target previous swing low or key support.
This is the most basic usage and works best on H1, H4, and D1, where structure is cleaner.
2. As a Confirmation Tool with Your Other Indicators
This is where it gets powerful.
🔹 With Kalman Filter Trend
- Only take BUY signals when:
- Kalman Trend is sloping up and price is at or above the Kalman line.
- Only take SELL signals when:
- Kalman Trend is sloping down and price is at or below the Kalman line.
Effect:
Kalman gives you a smooth trend, MarketStructureOscSignals gives you precise structure shifts. Together they filter out a lot of bad trades.
🔹 With Volume Profile / Support & Resistance
- Strong BUY:
- BUY arrow appears near VA Low, previous swing low, or liquidity sweep, with rejection.
- Strong SELL:
- SELL arrow appears near VA High, previous swing high, or liquidity sweep at the top.
Here the signal is not just a technical pattern but is also anchored in liquidity and order flow zones.
3. For Scaling In / Out
You can also use new signals as:
- Scale-In Points
Add to a position when a new signal appears in the same direction as your existing trade and the higher timeframe is aligned. - Early Exit / Partial Exit
If you’re long and a SELL signal appears against your position (especially near key structure), you can: - Close a part of the position
- Or tighten stops
🧪 Recommended Starting Settings
For Forex H1 / H4:
Swing Left = 2Swing Right = 2Min Bars Between Signals = 3Arrow Offset = 5–10 pips
For Indices M15 / H1:
Swing Left = 2–3Swing Right = 2–3Min Bars Between Signals = 5Arrow Offsetadapted to symbol (e.g. 20–50 “pips” depending on broker)
For Crypto H1 / H4:
- Slightly higher swings to filter noise:
Swing Left = 3Swing Right = 3Min Bars Between Signals = 4–6
Always backtest with your preferred instrument and timeframe to fine-tune Swing and MinBarsBetweenSignals.
Summary
Customer reviews
5 | 100 % | |
4 | 0 % | |
3 | 0 % | |
2 | 0 % | |
1 | 0 % |


