
Description
VOLUME PROFILE UPDATED VERSION
Compared to the previous version, this updated version includes critical bug fixes, new features, and significant performance improvements:
Fixes
- Fixed volume distribution: proportional allocation based on candle overlap instead of 100% to all touched levels
- Fixed VAH/VAL detection: tolerance scales with level height instead of hardcoded value
- Fixed text positioning: dynamic timeframe-based offsets instead of hardcoded days
- Fixed DateTime validation: empty bars check, out-of-range validation
Features
- Added Timezone Offset parameter for DateTime profiles
- Added Text Position parameter (Left/Right) for lookback mode
- DateTime mode labels now follow bar edges (variable width) or align at profile edge (full width)
Performance
- Binary search for DateTime index lookup (was O(n) linear)
- Cached total volume calculation (was recalculated per level)
- Pre-sized TPO dictionary to avoid resizing
- TryGetValue pattern for dictionary lookups
- Index-based loops replacing foreach in hot paths
Cleanup
- Removed ProfileWidth parameter (auto-calculated is always correct)
- Simplified candle intersection to single condition
__________________________________________________________________________________________
IMPORTANT NOTES - READ FIRST
Forex Volume Is Not Real Volume
Volume in forex is tick volume — it counts how many times price changes. It does NOT count how much money was traded.
What Tick Volume Cannot Show
- Trade size. A $100 trade and a $10,000,000 trade both count as 1 tick.
- Real money flow. You cannot see if big money or small money moved the price.
- True liquidity. You cannot see how many orders are waiting in the market.
- Bank activity. Banks see real volume data. You do not.
What This Means
Tick volume only shows how often price changed — not the money behind it. This creates problems:
- You cannot track banks or institutions. They use real volume data that you don't have access to.
- You cannot prove "smart money" theories. Those ideas need real volume, not tick counts.
- You cannot judge true liquidity. Tick activity does not show order depth or real market strength.
- You cannot measure real buying or selling power. Many small trades look the same as one big institutional trade.
- Volume spikes can lie. A spike might be just algorithmic noise, not real trading interest.
How to Use This Indicator Correctly
- Treat it as an activity meter, not a money meter. High tick volume = market is busy. Low tick volume = market is quiet. Nothing more.
- Compare activity between different times. Use it to see: Is London session busier than New York? Is today more active than yesterday? Is the trend period busier than consolidation?
- Combine it with price structure. Use support/resistance, swing points, or BOS/ChoCH together with volume. Price context prevents false signals from noisy volume spikes.
- Watch activity at important price levels. When price tests a key level and tick volume increases, it means more traders are active. It does NOT mean big players are involved.
- Do not assume it shows institutional activity. Tick volume cannot show accumulation, large orders, or "smart money." Use it only to measure rhythm and tempo.
__________________________________________________________________________________________
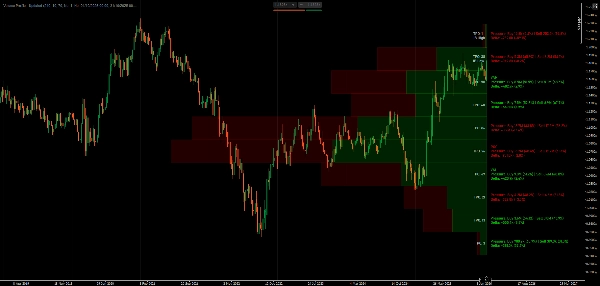
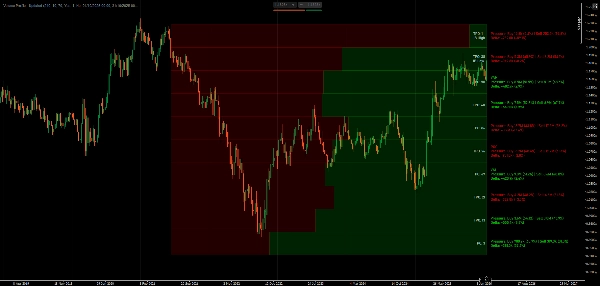
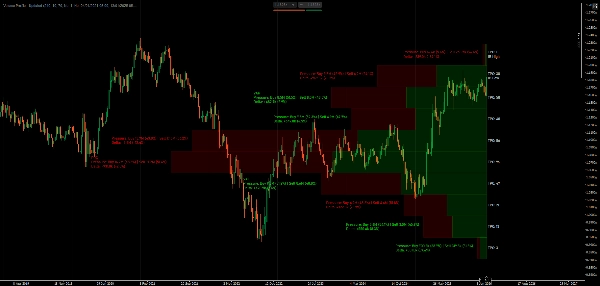
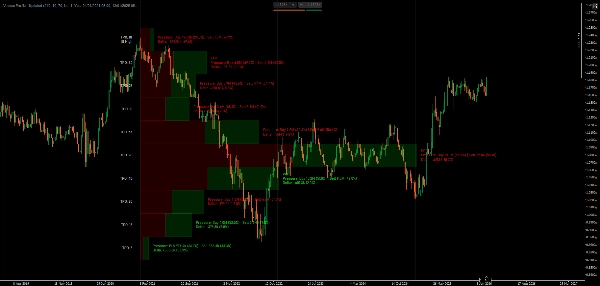
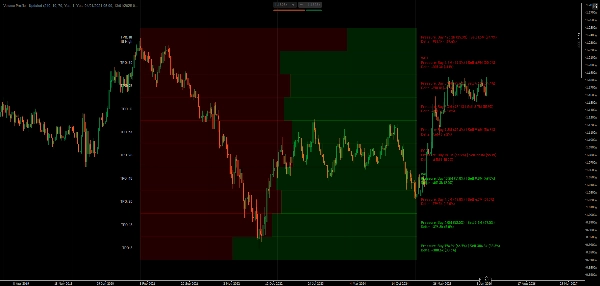
Visualize volume distribution and time-spent-at-price with POC, Value Area, and Market Profile TPO tracking.
This indicator shows volume distribution using Market Profile concepts. It displays the Point of Control (highest tick activity level), Value Area boundaries (where most trading occurred), TPO letter sequences (time spent at each price), and delta visualization that splits tick activity by candle direction.
You can choose lookback periods or set specific date ranges, display volume bars as proportional or full-width, toggle between all levels or key levels only, and customize colors for bullish/bearish activity.
FEATURES
Volume Distribution Analysis
- Point of Control (POC): Price level with highest activity—where price spent most time
- Value Area (VA): Customizable activity concentration zone (default 70%)—where most trading occurred
- VAH/VAL: Value Area High/Low boundaries—potential support/resistance levels
- Delta Visualization: Split bars show candle direction at each price level
Market Profile TPO
- Time Price Opportunity tracking: Count how many time periods traded at each price
- TPO letters: Visual representation of time spent at price (A-Z sequence)
- Initial Balance (IB): First hour's range—important for day trading structure
- IB High/Low markers: Opening range extremes
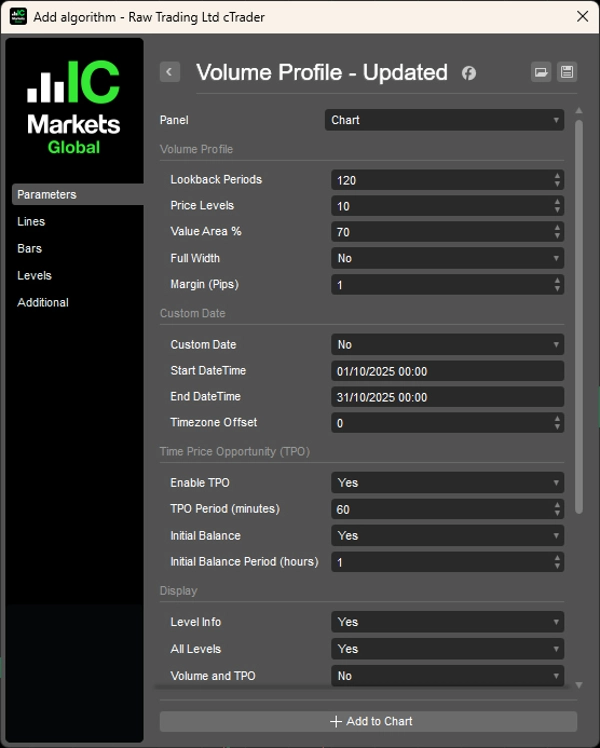
Flexible Lookback Options
- Period-based: Set number of bars to analyze (e.g., last 120 bars)
- DateTime range: Anchor profile between specific dates/times for event analysis
- Dynamic width: Auto-scale or fixed width profiles
Display Options
- Volume Bars: Proportional width (activity-scaled) or full-width uniform bars
- Candle direction split within each bar
- Delta calculations with percentages
- Toggle all levels or key levels only (POC, VAH, VAL)
- Volume/TPO detail visibility control
- Directional breakdown with percentages
- Adjustable font size and pip-based margins
Color Customization
- Independent colors for bullish/bearish direction bars
- Separate text colors for positive/negative delta
- TPO-specific text color
Performance Optimized
- Cached time lookups and efficient rectangle drawing
- Minimal recalculation for smooth performance
- Professional-grade delta calculation based on candle structure
__________________________________________________________________________________________
MORE FREE INDICATORS
Explore a wide range of market analysis tools—from structure and volume to regression, volatility, and custom timeframes.
Source code is available on GitHub repository.
All free to use. But if you feel like sending coffee support, you can route it here.
Support/Resistance
Volume
- Volume Activity Profiler
- Volume Efficiency Analyzer
- Volume Profile Analytics
- Volume Profile - Updated
- Volume Spread Analysis
- VWAP (Volume Weighted Average Price)
Moving Averages
- SSL Channel
- Anchored Moving Average
- Deviation-Scaled Moving Average
- Gann High Low Activator
- Instantaneous Trendline
- Kaufman Adaptive MA with Trend Vision
- Moving Average Channel
- Moving Averages Suite
- Trend Channel Moving Average
Utilities/Custom
Regression-Based
Volatility
Oscillators
__________________________________________________________________________________________
DISCLAIMER
Trading involves risk. This indicator is intended for technical analysis only — always apply proper risk management and trade responsibly.
FEECBACK & IMPROVEMENTS
If you have suggestions, feature requests, or ideas for enhancement, please leave a comment in the Discussion tab. Your feedback helps improve the indicator for everyone.
Summary
Key features include customizable lookback periods based on bar count or specific date/time ranges, dynamic or fixed profile widths, and display options for proportional or full-width volume bars. Users can toggle visibility of all levels or key levels (POC, VAH, VAL) and adjust colors independently for bullish/bearish bars and delta text. The indicator tracks Initial Balance (IB) ranges and marks IB High/Low for day trading structure.
Performance optimizations include binary search for DateTime lookups, cached volume calculations, and efficient data structures to minimize recalculations. The indicator uses tick volume, which counts price changes rather than actual traded volume, making it suitable as a market activity meter rather than a measure of real money flow or liquidity.
Supported markets include Forex, Indices, Commodities, Crypto, and Stocks. The indicator is intended for technical analysis and includes parameters for timezone offset and text positioning.
Customer reviews
5 | 100 % | |
4 | 0 % | |
3 | 0 % | |
2 | 0 % | |
1 | 0 % |


!["[Hamster-Coder] Bollinger Bands" logo](https://cdn.ctrader.com/image/webp/21d8e5d6-fb11-4bac-b9ee-cd05c2b76804_30327)


