
Description
The Dark Cloud Cover indicator is a technical analysis tool designed to identify potential bearish reversal patterns in the market. This pattern consists of two consecutive candlesticks:
- A bullish (green) candle that signals strong buying momentum.
- A bearish (red) candle that opens above the previous close but closes below the midpoint of the prior candle, indicating selling pressure.
This formation suggests a potential shift in market sentiment, where buyers lose control and sellers take over.
Features & Functionality:
- Pattern Detection:
- The indicator scans for the Dark Cloud Cover pattern based on candlestick price action.
- When detected, it visually highlights the pattern to alert traders.
- Trend Filter (Optional):
- To improve accuracy, the indicator includes an optional trend filter using a Moving Average (MA).
- If enabled, the pattern is only considered valid when occurring in an uptrend.
- Confirmation Logic:
- The indicator can validate the bearish signal by checking the next candle.
- A confirmation candle is identified if it closes below the Dark Cloud Cover low and has higher tick volume than the average of recent candles.
- This ensures stronger reliability of the signal.
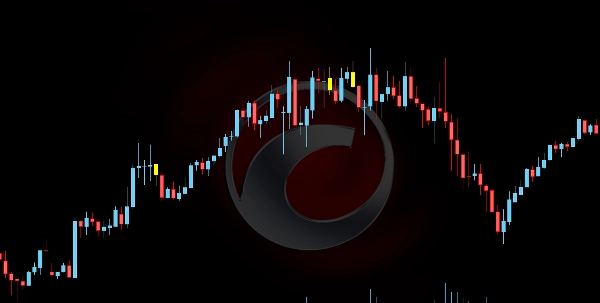
- Visual Markers:
- Yellow Candles: Mark the detected Dark Cloud Cover pattern.
- Orange Candles: Highlight the confirmation candle if volume conditions are met.
This indicator helps traders spot high-probability reversal setups, improving decision-making for short entries or risk management strategies.
Summary
AI summary
The Dark Cloud Cover indicator is a technical analysis tool that identifies a specific bearish reversal candlestick pattern. This pattern consists of two candles: a bullish (green) candle indicating strong buying momentum, followed by a bearish (red) candle that opens above the previous close but closes below the midpoint of the prior candle, signaling selling pressure and a potential shift from buyers to sellers.
Key features include:
- **Pattern Detection:** Automatically scans for the Dark Cloud Cover pattern based on candlestick price action and visually highlights detected patterns for trader awareness.
- **Optional Trend Filter:** Incorporates a Moving Average (MA) filter to validate patterns only during uptrends, enhancing signal accuracy.
- **Confirmation Logic:** Validates bearish signals by analyzing the subsequent candle, which must close below the pattern’s low with higher-than-average tick volume to confirm the reversal.
- **Visual Markers:** Uses yellow candles to mark detected patterns and orange candles to highlight confirmation candles meeting volume criteria.
This indicator assists traders in recognizing high-probability bearish reversal setups, supporting decision-making for short entries and risk management strategies.
Indicator profile
Customer reviews
0.0
Reviews: 0
Customer reviews
No reviews for this product yet. Already tried it? Be the first to tell others!
Discussion
FAQ
Signal
Products available through cTrader Store, including trading bots, indicators and plugins, are provided by third-party developers and made available for informational and technical access purposes only. cTrader Store is not a broker and does not provide investment advice, personal recommendations or any guarantee of future performance.
More from this author


Price
5
Sales
435
Free installs