"RangeBoxFibonacci" logo
RangeBoxFibonacci
5.0
Reviews: 1
"RangeBoxFibonacci" uploaded image
135
Sales
10.52K
Free installs

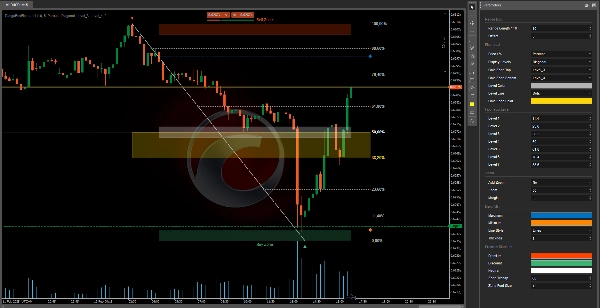
This Fibonacci retracement indicator allows traders to visualize and customize key retracement levels to identify potential buy and sell zones in the market.

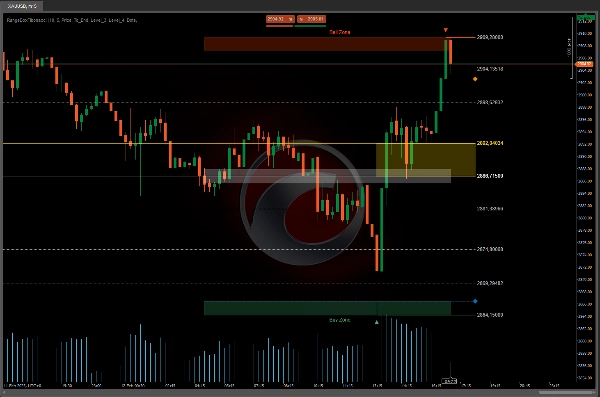
In addition to the colored "Sell Zone" and "Buy Zone", users can adjust the Fibonacci levels to their liking.

This indicator is complemented by a separate alerts indicator for a more complete trading experience.

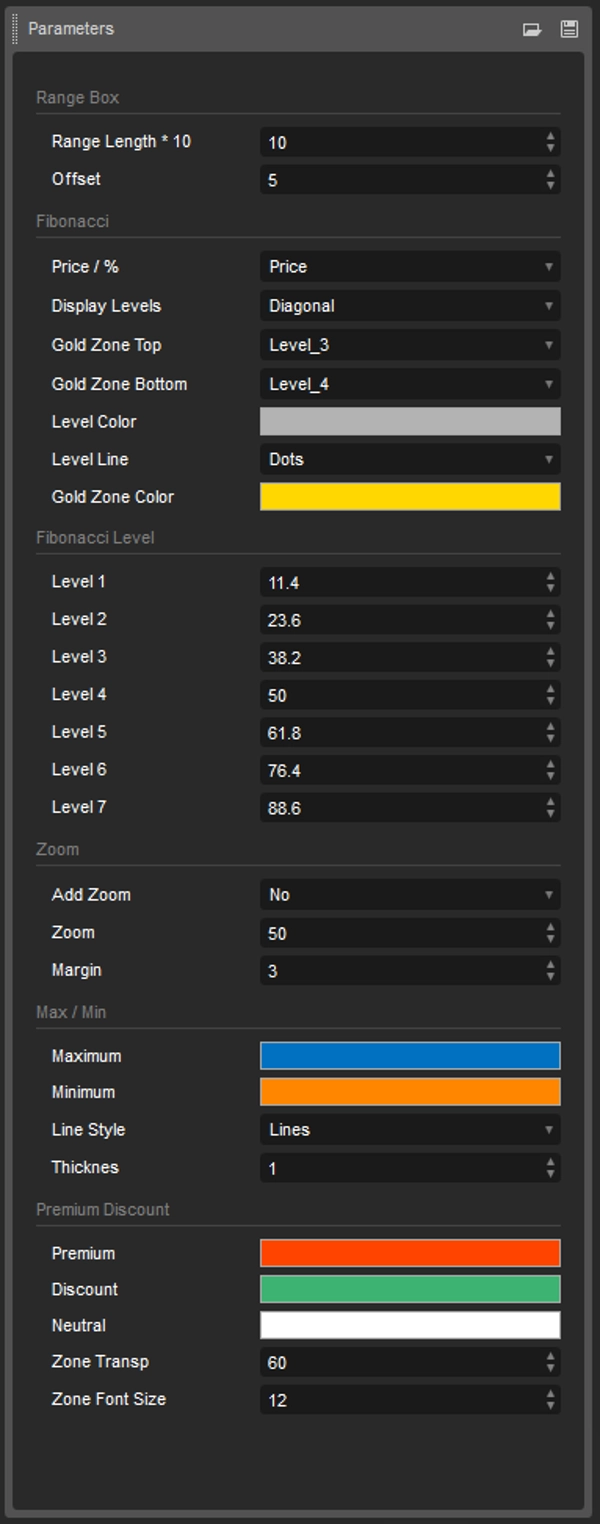
With this Fibonacci retracement indicator, traders have full control over the retracement levels displayed on the chart.

The ability to customize Fibonacci levels, along with colored zones and a separate alerts indicator, allows users to tailor the tool to their individual trading strategies.


If you include tools such as:

There is no way to lose a lot of money.

Indicator profile
5.0
Reviews: 1
5
100 %
4
0 %
3
0 %
2
0 %
1
0 %
Customer reviews
August 18, 2025
Displays Fibonacci zones in structured 9-level ranges. Lightweight and visually intuitive. Works on all timeframes. Cons: No alerts, tooltips, or preset saving. Needs confirmation tools to reduce subjectivity.
BTCUSD
Forex
Signal
Breakout
Indices
EURUSD
Commodities
GBPUSD
NZDUSD
Martingale
Prop
Scalping
Crypto
Grid
Stocks
XAUUSD
NAS100
USDJPY
Products available through cTrader Store, including trading bots, indicators and plugins, are provided by third-party developers and made available for informational and technical access purposes only. cTrader Store is not a broker and does not provide investment advice, personal recommendations or any guarantee of future performance.

More from this author

VWAP only timeframe
😎Read the description before purchasing💩
This indicator consists of 3 moving averages that can be configured to your liking, from the type of moving average....
This technical analysis indicator provides information on market sentiment, trend and price levels....
This bot can automatically generate buy and sell orders based on three specific Fixed bugs.
😎Read the description before purchasing💩
🔍 Discover All Candlestick Patterns… Absolutely Free!
A straightforward yet effective tool signals entry points for both buying and selling. Include 3 Moving Average
Session One is a tool for marking from to, useful if you've set the hours you want to trade
🚀 HAI QUANTUM v4.0 | The Ultimate Quantum Terminal for cTrader (Smart Money & Algorithmic Trading)
The Parabolic SAR, or "Stop and Reverse," is a dynamic technical analysis tool.

You may also like

Pivot-based Support and Resistance levels that extend until broken, with volume-confirmed break signals
This indicator is a powerful visualization tool 💡. Its design is flexible, robust, and solves a core problem for multi-
A straightforward yet effective tool signals entry points for both buying and selling. It incorporates FVG...
Indicator that calculates the slope of a moving average (SMA) and displays the value of the slope in degrees
A visual indicator designed to help traders identify and track market activity across different trading sessions.
The Zone Recovery indicator is used in an advanced hedging strategy, opening traders in the opposite direction.
[Hamster-Coder] Pivot Points (Standard)
Visualize trends with Standard Deviation Channel! Display median, and add customizable upper/lower deviation channels.
"EKVWAP" logo
4.3
(6)
Free
This is an advanced VWAP indicator (Anchored or non-Anchored) that allows you to customize all the aspects of it.
Spot Inside Bar breakouts across all timeframes on cTrader
RCS: 8 majors! AUD,USD,EUR,JPY,GBP,CAD,CHF,NZD. Find how strong each currency is relatively and trade smarter!
Stochastic Confluence Pro (RSI + Divergence)
The Trend Angle Indicator provides a clear and intuitive way to visualize market trends.
Auto Trendlines, Fibonacci, Pitchfork and Patterns from non‑repainting pivots. One‑click Presets, targeted Alerts, and a
Technical self-analysis Pro ,Audible signal, automatic technical calculation.
this indicaotr show distance between Tenkan to Kijun, Close to Kijun and Close to Tenkan 
A volatility-adaptive trend-following indicator that dynamically adjusts to market conditions.
Crossover Buy and Sell Alerts and signals
135
Sales
10.52K
Free installs