
Description
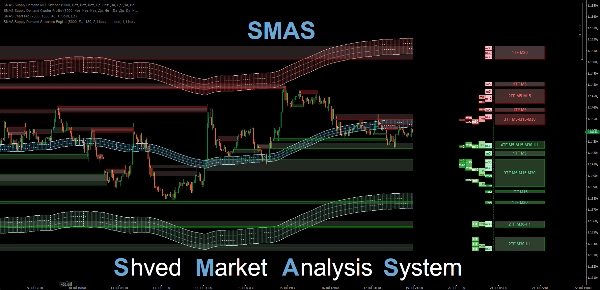
SMAS Supply & Demand Cluster Profile part SMAS
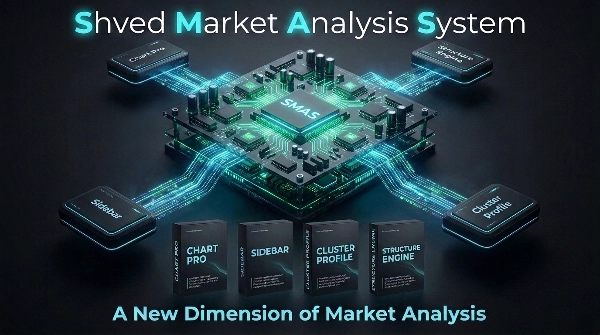
SMAS Supply & Demand Cluster Profile is a professional market analysis tool developed by the creator of the widely acclaimed Shved Supply and Demand indicator, which has earned recognition among thousands of traders worldwide. This indicator serves as an integral and connecting component of the unified SMAS (Shved Market Analysis System) ecosystem.
The primary objective of the indicator is to organize the multi-timeframe market structure and eliminate chart clutter by consolidating fragmented price levels into a single, logical map.
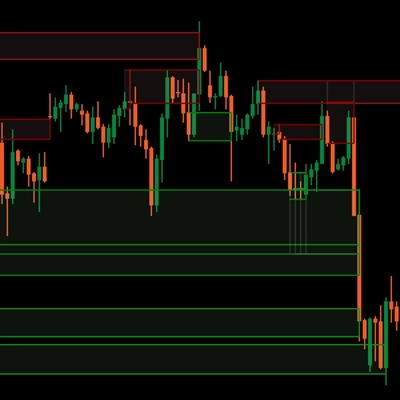
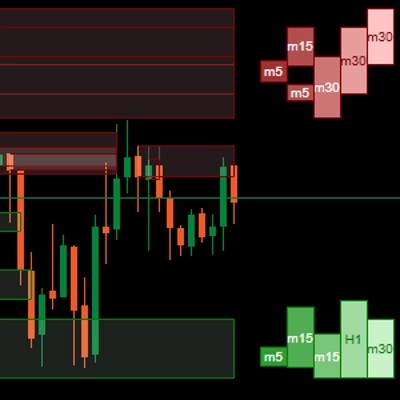
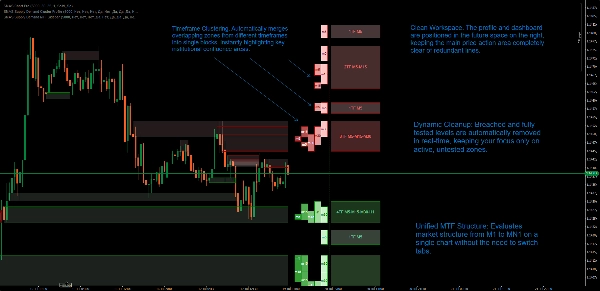
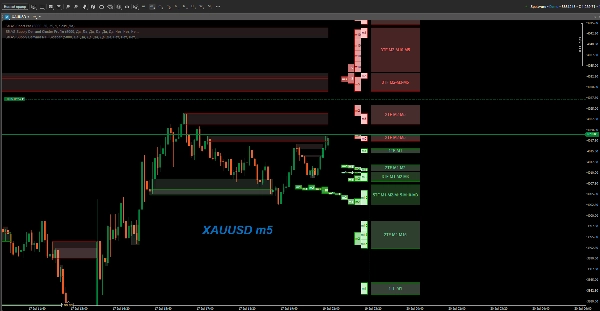
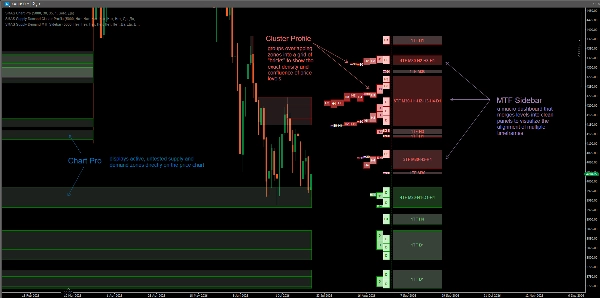
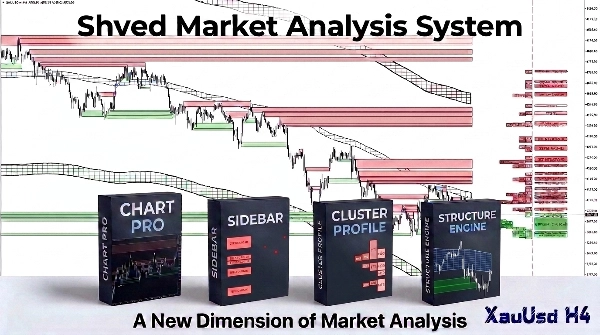
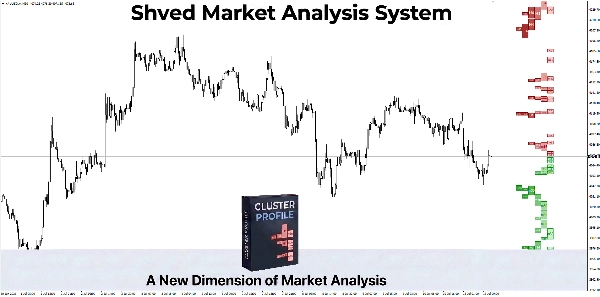
Conventional supply and demand indicators often overwhelm charts with overlapping rectangles. SMAS Cluster Profile resolves this issue using an automated clustering algorithm. It scans selected timeframes (from M1 to MN1) and aggregates overlapping zones into consolidated blocks (clusters) on the right side of the screen, clearly visualizing areas of institutional confluence.
- Timeframe Confluence: Combines zones from multiple timeframes into unified blocks. The height and color density of each block indicate the number of overlapping levels, streamlining strength assessment.
- Ergonomic & Clean Chart Design: The entire profile histogram and supporting sidebar are projected into the future space (on the right of the current price), keeping the main candlestick area completely clear for comfortable analysis.
- Seamless SMAS Integration: Designed to work in perfect harmony with other components of the ecosystem (such as SMAS Chart Pro and SMAS MTF Sidebar), creating a comprehensive setup for professional trading.
- Dynamic Relevance Filter: The algorithm monitors price action in real-time and immediately removes breached levels, keeping your chart focused strictly on untested liquidity zones.
- Engineered for Performance: Written in C# specifically for the cTrader API with asynchronous timer-based calculations and fast data caching, ensuring high terminal performance.
SMAS Cluster Profile represents years of trading experience and community feedback from the original Shved Supply and Demand indicator, delivered as a next-generation analytical system.
SMAS Supply & Demand Cluster Profile часть системы SMAS
SMAS Supply & Demand Cluster Profile — это профессиональный инструмент анализа рынка, разработанный автором широко известного индикатора Shved Supply and Demand, завоевавшего признание среди тысяч трейдеров по всему миру. Данный индикатор является неотъемлемой и связующей частью единой торговой экосистемы SMAS (Shved Market Analysis System).
Основная задача индикатора — систематизировать многотаймфреймовую структуру рынка и избавить график от хаотичного нагромождения уровней, объединяя разрозненную информацию в единую логическую карту.
Классические индикаторы зон спроса и предложения часто перегружают график пересекающимися прямоугольниками. SMAS Cluster Profile решает эту проблему, используя алгоритм автоматической кластеризации. Он сканирует выбранные интервалы (от M1 до MN1) и группирует перекрывающиеся зоны в единые блоки (кластеры) в правой части экрана, наглядно показывая места пересечения интересов крупных игроков (Confluence).
- Слияние таймфреймов (Confluence): Объединяет зоны разных ТФ в общие блоки. Высота и плотность цвета блока указывают на количество совпавших уровней, помогая быстро оценивать силу диапазона.
- Эргономика и чистый график: Вся гистограмма профиля и вспомогательный сайдбар вынесены в будущую область графика (справа от цены), оставляя зону свечей полностью свободной для комфортного технического анализа.
- Интеграция в экосистему SMAS: Индикатор спроектирован для бесшовной совместной работы с другими модулями системы (такими как SMAS Chart Pro и SMAS MTF Sidebar), формируя комплексное решение для профессионального трейдинга.
- Динамический фильтр актуальности: Алгоритм в реальном времени отслеживает пробитие уровней ценой и мгновенно удаляет отработанные зоны спроса и предложения, оставляя только актуальные ориентиры.
- Глубокая оптимизация: Код написан на C# специально под API cTrader с использованием асинхронного таймера и быстрого кэширования данных, что гарантирует стабильно высокую производительность терминала.
SMAS Cluster Profile — это результат многолетней практики и анализа отзывов сообщества пользователей оригинального индикатора Shved Supply and Demand, воплощенный в виде аналитической системы нового поколения.
Summary
The indicator employs an automated clustering algorithm to reduce chart clutter caused by conventional supply and demand indicators that display numerous overlapping rectangles. It dynamically filters out breached levels in real-time, maintaining focus on active liquidity zones. The profile histogram and sidebar are positioned in the future price area, keeping the main candlestick chart clear for technical analysis.
Developed in C# for the cTrader platform, the indicator features asynchronous calculations and efficient data caching to ensure high performance. It integrates seamlessly with other components of the Shved Market Analysis System (SMAS) ecosystem, such as SMAS Chart Pro and SMAS MTF Sidebar, providing a comprehensive toolset for professional trading. The product supports visualization and signals for level touches and breaks based on bar data.