"WT - PJER" logo
Indicator
3 purchases
Version 2.0, Jan 2026
Windows, Mac
5.0
Reviews: 1
"WT - PJER" uploaded image
88.59M
Traded volume
105.61K
Pips won
58
Sales
413
Free installs

Price Jump Exit and Re-entry (PjER ) Indicator is a risk management indicator based on the academic paper “A dynamic price jump exit and reentry strategy for intraday trading” by Koegelenberg & van Vuuren (2024), Published in Expert Systems With Applications Journal.


Key Innovation

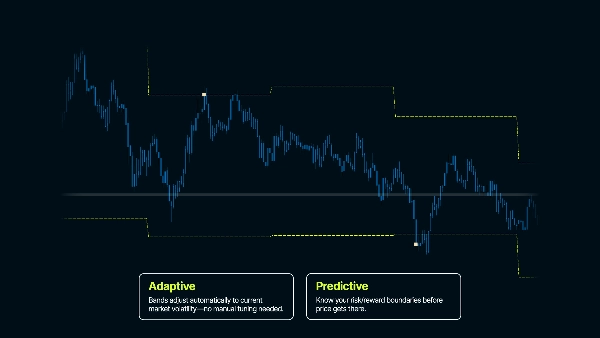
  • VaR estimates of potential losses before they occur
  • Robustness against strong market trends over short timeframes
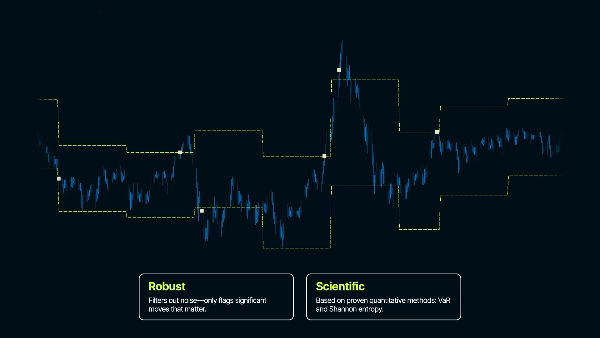
  • Post-jump market correction analysis for safe re-entry timing

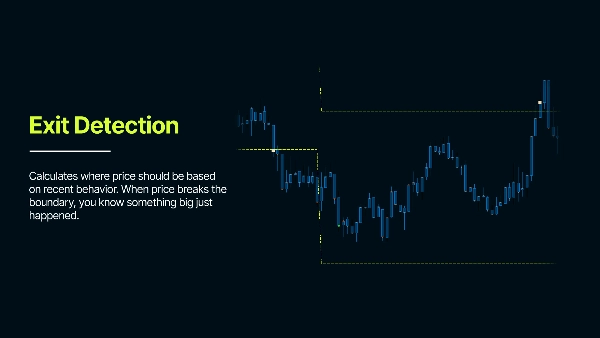
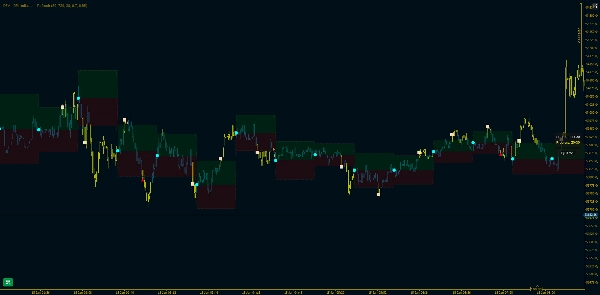
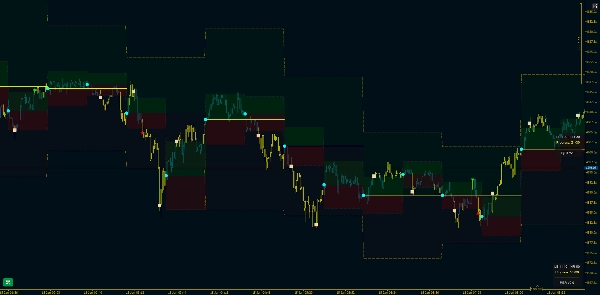
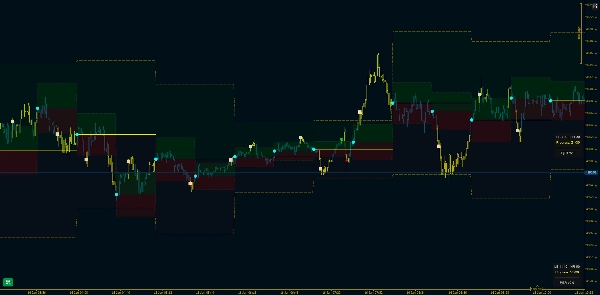
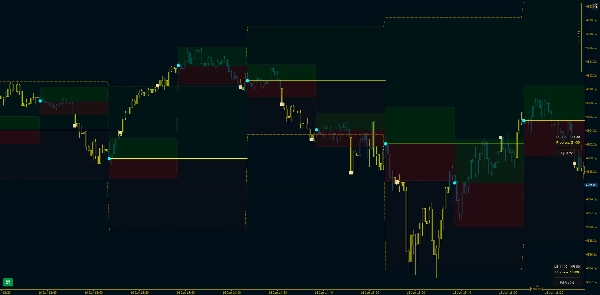
It analyzes past price movements to understand typical volatility and Creates Confidence Intervals - representing the expected price range. When price jumps outside these bands it signals that something abnormal happened.


Target Use Case

Intraday trading (especially range-based strategies). This indicator creates statistical boundaries around price to detect abnormal price movements. In normal market behavior price stays within expected ranges based on recent volatility. When price breaks these bands, it signals that something unusual is happening - a potential exit point from a trade or a breakout in market strucutre, because the market behavior has changed.


Core Parameters Explained

Max Days Back - Determines how far back in history the indicator starts working

GMT Offset - Adjusts for your timezone. Ensures date calculations match your local time

Lookback Period (bars)

"How much price history should I use to measure 'normal' behavior?"
  • How many bars of historical data to use for calculating volatility
  • More bars = more stable but slower to adapt; fewer bars = faster reaction but noisier
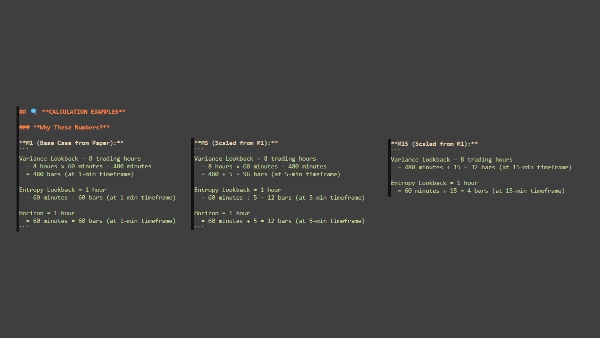
  • Example: 1440 bars on M1 = 24 hours of data

Analysis Horizon (bars)

 "How long should I watch price before starting fresh?
  • How long each analysis period lasts before bands reset
  • Sets the timeframe you're analyzing - shorter = more frequent resets, longer = bands stay fixed longer
  • Example: 60 bars = bands stay for 60 bars, then recalculate from new reference price

Risk Probability

"How sure do I want to be that price won't normally reach these levels?"
  • Sets the confidence level for the bands (like a safety margin)
  • Higher values = wider bands (fewer signals), lower values = tighter bands (more signals)
  • Example: 0.80 = 80% confidence that price stays within bands under normal conditions

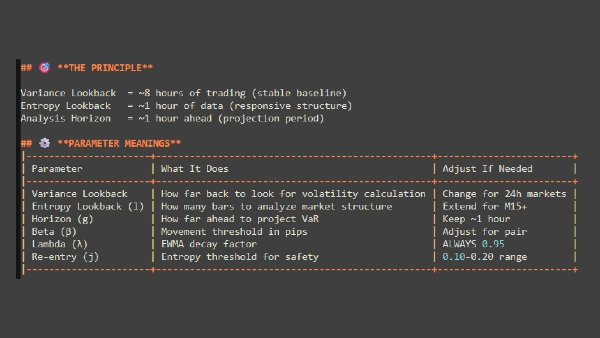
Decay Factor (λ - Lambda)

"Should I care more about what just happened or treat all history equally?"
  • Controls how much weight to give recent data vs older data in volatility calculations
  • Higher values = recent data matters more; lower values = all data weighted more equally
  • Example 0.95 = recent volatility heavily influences the calculation


KEY POINTS TO REMEMBER

This is a RISK MANAGEMENT tool  – Identifies volatility events and stability over periods of time
Confidence Intervals are critical – Bands must NOT follow price like ATR – Bands are calculated for each analysis period
Re-entry requires patience – Don’t expect instant re-entry after exit – Market needs time to stabilize
Parameters are asset and timeframe specific – Default parameters are starting points – Optimize for your specific market and style – What works in FX  might not work for Indices, Metals or Crypto.


( * ) This indicator is provided for educational and informational purposes only. It is not intended as financial or investment advice. Nothing in this product, its documentation, or any related materials should be construed as a recommendation to buy, sell, or hold any financial instrument. Trading in financial markets involves significant risk and may not be suitable for all investors. Past performance is not indicative of future results. There is no guarantee of profits, and users may incur substantial losses. By using this indicator, you acknowledge that you are solely responsible for your own trading decisions and financial outcomes. The creator of this product shall not be held liable for any losses or damages arising directly or indirectly from its use. Always conduct your own analysis before making any trading decisions.

Indicator profile
5.0
Reviews: 1
5
100 %
4
0 %
3
0 %
2
0 %
1
0 %
Customer reviews
November 30, 2025
WT-PJER aims to flag volatility spikes and market momentum, giving traders early heads-up on potential big moves. A handy volatility & impulse filter, but not a standalone signal generator. Works best when paired with structure/volume confirmation. More reliable on mid to higher timeframes. Alerts and clear signal definitions would make it stronger.
Forex
Signal
Breakout
Indices
Commodities
Crypto
Products available through cTrader Store, including trading bots, indicators and plugins, are provided by third-party developers and made available for informational and technical access purposes only. cTrader Store is not a broker and does not provide investment advice, personal recommendations or any guarantee of future performance.

More from this author

Indicator
Prop
Forex
+12
Lightweight Risk-Reward Visualization Tool.
Desktop plugin
Prop
Forex
+11
Build custom second and tick charts using adjustable bar sampling intervals.
Desktop plugin
Stocks
Indices
+1
Build custom charts based on specific trading sessions.
cBot
Prop
Forex
+4
Turn Your Keyboard into a Trading Console — Instant Entries, Exits, and Precision Risk Control.
Indicator
Prop
Forex
+13
A real-time tick imbalance analysis tool designed specifically for Tick Imbalance Bars Plugin*
Indicator
Forex
Crypto
+5
Experience a new approach with amplitude-based momentum analysis. Smart Trend Detection That Adapts to Market Volatility
Desktop plugin
Forex
Signal
+2
Adaptive Renko chart builder for precise, flexible trading - ideal for both scalping and trend analysis.
Indicator
Imbalance
Key Levels
+2
A Next-Generation Adaptive Oscillator with Z-Score Regime Engine.
Indicator
Prop
Forex
+5
A channel-based trend indicator that combines three distinct analytical layers into a single, readable overlay.
cBot
Prop
Forex
+5
The FDQ Price Channel cBot automates the full trading logic of the FDQ Price Channel.
15.2%
ROI
1.5
Profit factor
20%
Max drawdown
cBot
Prop
Forex
+5
Trend continuation and pullback exhaustion signals — three independent entry types, one system.
1.5
Profit factor
15%
Max drawdown
Indicator
Forex
Crypto
+5
This indicator combines two independent analytical engines into a single overlay on your chart.

You may also like

Indicator
Moving Average
An Indicator made for scalping. Shows you the Sniper movement on Chart with the colour signals.
Indicator
The Multi-Timeframe Candle Indicator displays candles from multiple timeframes in one window, enhancing market analysis!
Indicator
EMA
RSI
+5
MACD Colour Histogram with 11 Moving Average Types, Multi-timeframe confirmation and Sound Signal Alert.
Indicator
Prop
Forex
+10
Heatmap Pro analiza la volatilidad, el volumen y la acción del precio para "pintar" tu gráfico con zonas de color.
Indicator
Forex
Crypto
+2
PREMIUN INDICATOR
Indicator
Prop
Forex
+4
Risk Reward Management Tools(风险回报管理工具)
Indicator
Supertrend
smart System
Indicator
Prop
VWAP
+13
Rolling VWAP with dynamic or fixed time window, customizable source price and standard deviation bands.
Indicator
ATR
BOS
+5
Sniper Edge: Multi-timeframe (M5-H1) cTrader indicator with winrate dashboard & multi-asset alerts (Gold, BTC).
Indicator
Crypto
Signal
+3
Candlestick Signal Finder: cTrader indicator that automatically detects and color-codes key Japanese candlestick pattern
Indicator
ATR
SMC
+19
Smart Liquidity Sweep detector with auto-drawing True Channels and real market structure mapping.
Indicator
Forex
Crypto
+3
MARainbow gives you the edge with four customizable moving averages—each color-coded for instant recognition.
Indicator
ATR
SMC
+17
Adaptive Swing-Anchored VWAP that tracks market structure shifts with precision and clarity.
Indicator
Imbalance
Key Levels
+2
A Next-Generation Adaptive Oscillator with Z-Score Regime Engine.
Indicator
Prop
Forex
+11
🌊 See when the market is truly in play. Tsunami measures Relative Volume by time-of-day 🌊
Indicator
Forex
Crypto
+2
Unique Pyramid Design , Clear Price Action Trend
Indicator
RSI
Breakout
+1
"Identify key market zones and visualize support/resistance from multiple timeframes on a single chart.
Indicator
Customizable window inside your platform, access to any website Calendar
88.59M
Traded volume
105.61K
Pips won
58
Sales
413
Free installs