Description
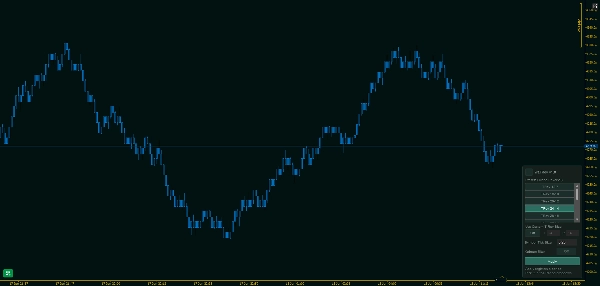
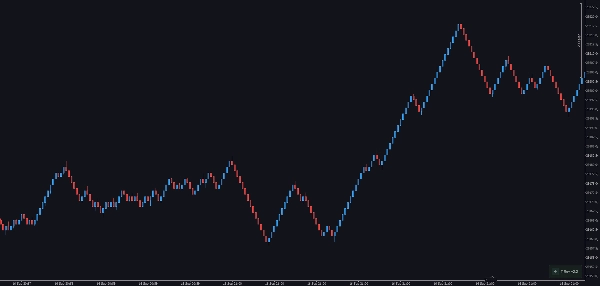
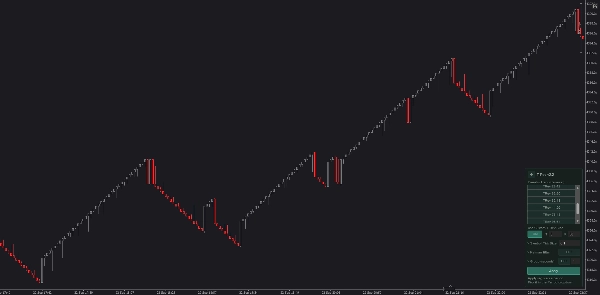
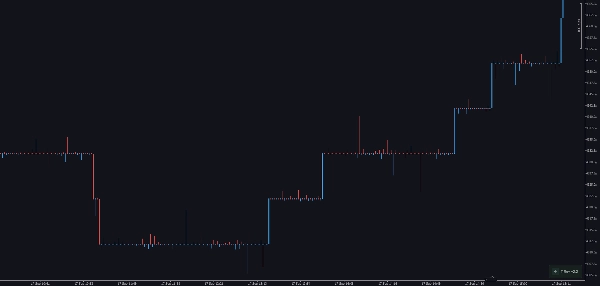
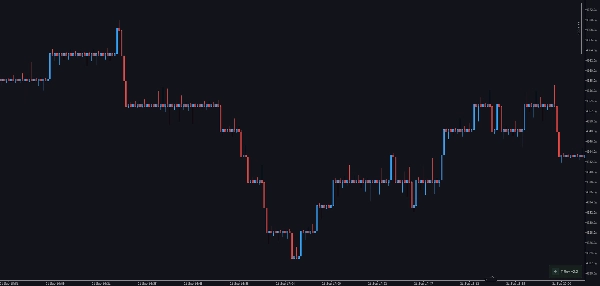
Trend Reversal (TRev) charts plot candlesticks according to the distance price moves, not the passage of time.
In this sense they are related to Point & Figure (P&F) charts — but where a single P&F column represents an entire trend until price reverses, a TRev chart shows a continuing trend as a series of candles.
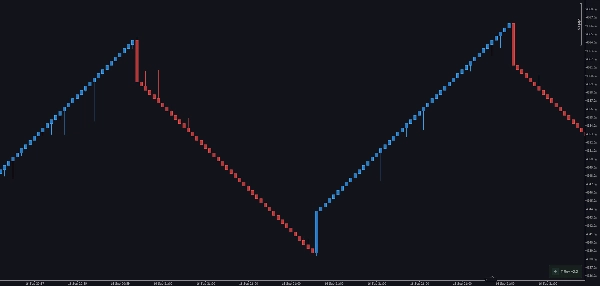
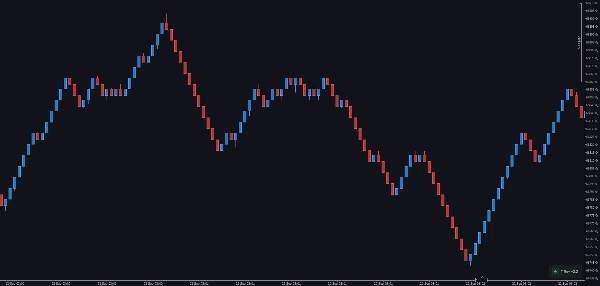
This is because in a TRev chart a new candle forms every time price moves a set number of ticks in any direction — so an extended move prints multiple trending candles one after another, giving you a much finer view of how a trend develops.
For usage guide of plugin and the On-chart Panel - please refer to "Custom Timeframes Plugin" Video Presentation, as it follows the same usage / methods.
Trending and Reversal Candles
Like P&F charts, TRev charts contain two kinds of candles.
- Reversal candles form the same way as in a P&F chart: a new candle is plotted when price moves a set number of ticks against the current direction (the reversal size).
- Trending candles are where TRev differs from P&F: a new trending candle forms every time price continues in the same direction for a set number of ticks (the trend size).
You configure two values — the trend size and the reversal size. By convention the trend size is roughly 1,68 × the reversal size, though you are free to use any ratio.
Example:
Say you set a reversal size of 500 ticks, giving a trend size of 840 (500 × 1,68 ≈ 840):
Price is moving up, then reverses by 500 ticks → a new reversal candle is plotted.
Price instead continues up by 840 ticks → a new trending candle is plotted.
Why TRev candles only have a wick on one side
Look at a TRev chart and you'll notice each candle has a wick only on its opening side. This falls directly out of how the candles are built. Take a green (up) candle. In a normal time-based candle, an open-side wick means price dropped below the open, and a close-side wick means price rose above the close. On a TRev green candle:
An open-side wick can form — it means price dipped, but not by the full reversal size (e.g. 500 ticks) needed to start a new reversal candle. A close-side wick cannot form — the candle only closes once price has travelled the trend size (e.g. 840 ticks) from the open. Price can't overshoot and come back within the same candle, because the moment it reaches 840 ticks, a new trending candle begins. Red (down) candles follow the same rule mirrored: the wick sits on the open (upper) side, and the low is the close.
Choosing a TRev Chart in the Plugin
This plugin adds TRev periods to cTrader's normal Period dropdown, and gives you an on-chart control panel to create them. In both the period name and the panel, the first number is the trend size and the second number is the reversal size — e.g. 16-10 means trend 16, reversal 10.
Each period name encodes everything that defines the bars, in the form:
[symbol:]{trend}-{reversal} - {tick size} - {K|O}
where K = Kalman filter active and O = Original (raw, Kalman off). For example, XAU:16-10 - 0.25 - K is a Kalman TRev on XAU, trend 16, reversal 10, tick size 0.25.
You can set the rotational period of a TRev candle in two ways:
- Pick a preset. The panel lists the standard trend-reversal pairs in a scrollable list. With the Use Custom T-Rev Size toggle set to Off, the highlighted preset is used.
- Enter custom ranges. Set the Use Custom T-Rev Size toggle to On and type your own Trend (T) and Reversal (R) values on the same line.
Either way, press Apply to register the period. It then appears in cTrader's Period dropdown, ready to select.
Available presets
The built-in presets (trend-reversal) are: 12 - 7 // 16 - 10 // 20 - 12 // 24 - 14 // 28 - 16 // 28 - 14 // 28 - 12 // 32 - 20 // 32 - 18 // 44 - 26 // 78 - 48 // 96 - 64 // 120 - 82 // 210 - 125
Additional options
Symbol Tick Size — the tick size used for all threshold math, set directly in the panel. This value is always applied, so the trend and reversal distances are measured in consistent price increments regardless of the instrument's native tick. It is part of the period name.
Kalman filter (Off/On) — an optional price denoiser. When on, the raw price is smoothed before the trend/reversal threshold is tested, so single-tick spikes don't prematurely close a candle. The candle's OHLC always tracks the raw price; only the timing of when a candle closes is affected. In the period name, Kalman-on is marked K and Kalman-off is marked O (Original), so the two are distinct periods you can run side by side.
Break at EOD — optionally restart candle formation at the start of each new trading day.
Benefits of TRev Charts
Like P&F charts, TRev charts make it easy to see where price ranges for a meaningful amount of time. By stripping out the noise of minor, time-based fluctuations, they make trends and reversals far more obvious.
When you see a cluster of reversal candles following one another, it marks a choppy area in the market — a sign of absorption or distribution. These zones stand out clearly on a TRev chart, which makes identifying support and resistance more straightforward.
Absorption refers to price levels where a large volume trades on both the buy and sell side without price moving substantially — essentially where market participants meet and do most of their trading without pushing the market, leaving both buyers and sellers filled.
Summary
TRev charts feature two candle types: reversal candles, which form when price reverses by a set tick amount, and trending candles, which form when price continues in the same direction by a set tick amount. Users configure both trend size and reversal size, with a typical trend size approximately 1.68 times the reversal size. Each candle has a wick only on its opening side, reflecting the unique formation rules.
The plugin integrates TRev periods into cTrader’s period dropdown and includes an on-chart control panel for selecting presets or entering custom trend and reversal sizes. Additional options include setting symbol tick size, applying a Kalman filter for price smoothing, and restarting candle formation at the start of each trading day.
TRev charts help identify price ranges, trends, reversals, and zones of absorption or distribution by filtering out minor time-based fluctuations, aiding in clearer support and resistance analysis.