present
Sign up and get $50 off your first purchase
Trading product for wt.Custom Session Desktop plugin Indices Commodities, image 1
wt.Custom Session
5.0
Reviews: 1
99.81M
Traded volume
150.07K
Pips won
100
Sales
535
Free installs

Description

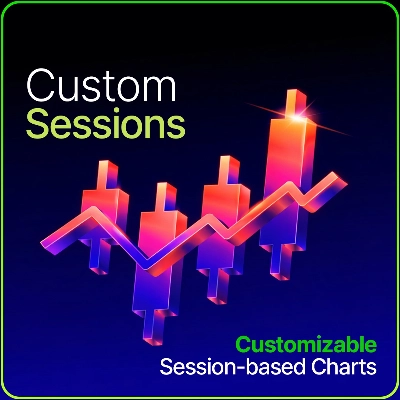
Build custom charts based on specific trading sessions, using fully configurable session time windows. Analyze price action only where it matters most. See the video tutorial below to get started.


Summary

AI summary
wt.Custom Session is a plugin that enables users to create custom charts focused on specific trading sessions. It allows full configuration of session time windows, helping traders analyze price action during selected periods that are most relevant to their strategies. The plugin supports markets including indices, commodities, and stocks. This tool is designed to refine chart analysis by isolating trading activity within defined time frames.
Plugin profile

Discussion

Customer reviews

5.0
Reviews: 1
5
100 %
4
0 %
3
0 %
2
0 %
1
0 %
Customer reviews
January 23, 2026
wt.Custom Session lets you carve your chart into custom trading hours - embrace only the sessions you care about and ignore the rest. A lightweight desktop tool to focus on price action during your chosen market windows. Clean, no-nonsense, and useful if your strategy revolves around market hours

FAQ

Indices
Commodities
Stocks
Products available through cTrader Store, including trading bots, indicators and plugins, are provided by third-party developers and made available for informational and technical access purposes only. cTrader Store is not a broker and does not provide investment advice, personal recommendations or any guarantee of future performance.
More from this author

Lightweight Risk-Reward Visualization Tool.
Seconds | Ticks | Range | RangeY | Delta | Heikin-Ashi Bar types. Any size or Symbol.
EasyCharts™ is a cTrader Plugin that syncs technical drawings across all open charts of the same symbol.
Turn Your Keyboard into a Trading Console — Instant Entries, Exits, and Precision Risk Control.
EasyCharts™ — Keep Drawings in Sync Across Charts
Experience a new approach with amplitude-based momentum analysis. Smart Trend Detection That Adapts to Market Volatility
A trend-regime system for cTrader — spot the trend, the pullback zone and your stop in one glance.
This indicator combines two independent analytical engines into a single overlay on your chart.
⚡Place orders, set SL/TP, and manage positions with Hotkeys or directly on the chart.
Read price differently. Measure what the market actually does.
Trend Reversal (TRev) charts plot candlesticks according to the distance price moves, not the passage of time.
Spot the moments when price and order flow disagree - across every timeframe, at a glance.

You may also like

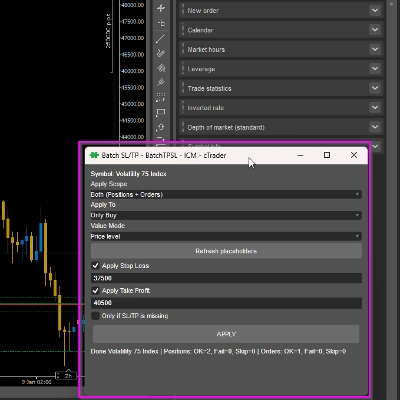
Apply Stop Loss and Take Profit to all positions and pending orders in one click.
Journal, stats, trade analysis, a daily coach and a daily bias for your real cTrader trades. Know why you lose; fix it.
See your live exposure, risk and open-position health - all in one real-time dashboard.
"TradeGuard" logo
4.6
(3)
$25
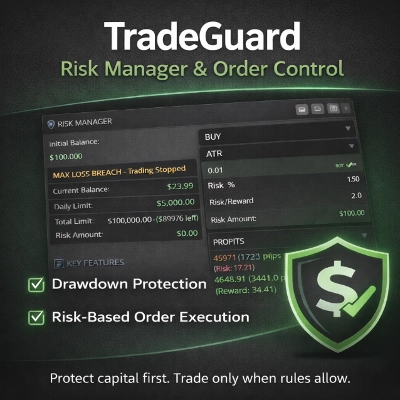
cTrader risk management plugin with daily & total drawdown limits, CBot control, and risk-based order execution.
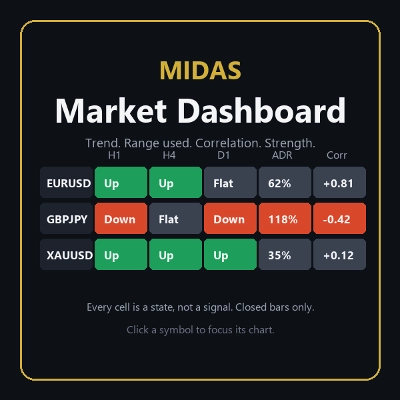
Your watchlist in one grid: trend on five timeframes, ADR used, correlation to the chart's symbol, currency strength.
Seconds | Ticks | Range | RangeY | Delta | Heikin-Ashi Bar types. Any size or Symbol.
This is a sample plugin that allows directly accessing cTrader web inside cTrader desktop.
Trade Analytics delivers advanced trading insights and heatmaps directly inside TradeWatch.
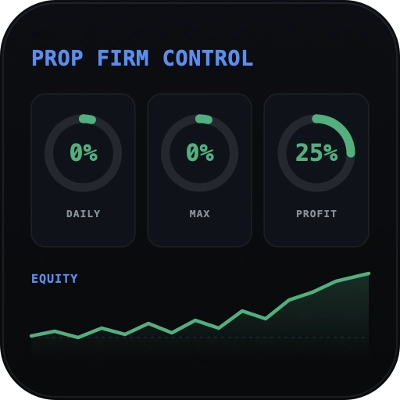
Read-only risk cockpit for prop-firm traders: live drawdown gauges, FTMO-style permitted loss, alerts and reports.
Replay your broker’s charts candle by candle. Rewind any time, switch timeframes and practise trades with full stats.
Turn your cTrader trade history into a visual performance dashboard to see trading patterns and strategy strength
ChatGPT Plugin for cTrader
The Risk-Reward plugin is a tool to visualize a trading idea based on other analysis tools,
Visual monthly trading journal that displays your performance day-by-day in a calendar view.
Drag SL & TP on the chart, see risk, reward, R:R and lot size live, then place Buy or Sell orders in one click
Real Quant Audit, Live equity, open-position risk and 24 quant tests on your full account. IS THE EDGE REAL?
Risk Reward management tools (风险回报管理工具)
Study economic event reactions with broker M1 history, bar replay, range comparisons and a reproducible export.

Price

99.81M
Traded volume
150.07K
Pips won
100
Sales
535
Free installs