Brokers & props
For business
00
Days
:
00
Hours
:
00
Minutes
:
00
Seconds
Indicator
NAS100
NZDUSD
XAUUSD
Commodities
Forex
Signal
EURUSD
GBPUSD
BTCUSD
Indices
Prop
Stocks
Crypto
USDJPY
Scalping
WT - Amplitude - Momentum Detection
5.0
05/12/2025
6
Desktop
Since 13/01/2025
Traded volume
16.64M
Pips won
32.96K
Sales
13
Free installs
21
"WT - Amplitude - Momentum Detection" uploaded image"WT - Amplitude - Momentum Detection" uploaded image"WT - Amplitude - Momentum Detection" uploaded image"WT - Amplitude - Momentum Detection" uploaded image"WT - Amplitude - Momentum Detection" uploaded image"WT - Amplitude - Momentum Detection" uploaded image"WT - Amplitude - Momentum Detection" uploaded image
About trial version
Let the market show you when momentum shifts—automatically. Advanced amplitude analysis with self-optimizing intelligence adapts to any symbol you trade. One click, perfect settings! Features Available in Trial Version: ✅ Full feature demonstration - for the Core Amplitude-based Momentum Detection ✅ Enough time to evaluate ✅ Real statistics - with actual performance data ✅ Self-optimization - find best settings in seconds ✅ Test Core Algorithm on any market Features NOT Available in Trial Version: ❌ Layer 2 and Layer 3 Components ❌ Trial Version can be applied only on 1 Minute Timeframe ❌ No Calculations for Live Markets

⎽⎽⎽⎽⎽⎽⎽⎽⎽⎽⎽⎽⎽⎽⎽⎽⎽⎽⎽⎽⎽⎽⎽⎽⎽⎽⎽⎽⎽⎽⎽⎽⎽⎽⎽⎽⎽⎽⎽⎽⎽⎽⎽⎽⎽⎽⎽⎽⎽⎽⎽⎽⎽⎽⎽⎽⎽⎽⎽⎽⎽⎽⎽⎽⎽⎽⎽⎽⎽⎽⎽⎽⎽⎽⎽⎽⎽⎽⎽⎽⎽⎽⎽⎽⎽⎽⎽⎽⎽⎽⎽⎽⎽⎽⎽⎽⎽⎽⎽⎽⎽⎽⎽⎽⎽⎽⎽⎽⎽⎽⎽⎽

Amplitude Momentum Label — Adaptive Trend Detection Powered by Volatility

⎽⎽⎽⎽⎽⎽⎽⎽⎽⎽⎽⎽⎽⎽⎽⎽⎽⎽⎽⎽⎽⎽⎽⎽⎽⎽⎽⎽⎽⎽⎽⎽⎽⎽⎽⎽⎽⎽⎽⎽⎽⎽⎽⎽⎽⎽⎽⎽⎽⎽⎽⎽⎽⎽⎽⎽⎽⎽⎽⎽⎽⎽⎽⎽⎽⎽⎽⎽⎽⎽⎽⎽⎽⎽⎽⎽⎽⎽⎽⎽⎽⎽⎽⎽⎽⎽⎽⎽⎽⎽⎽⎽⎽⎽⎽⎽⎽⎽⎽⎽⎽⎽⎽⎽⎽⎽⎽⎽⎽⎽⎽⎽


The Amplitude Momentum Labeler unifies multiple advanced concepts:

  1. Regime Detection — Identifies true trend phases
  2. Volatility Adaptation — Self-tunes to current market conditions
  3. Dynamic VWAP — Highlights meaningful pullback and continuation levels
  4. Roll Spread Estimator — Signals optimal re-entry points during trends
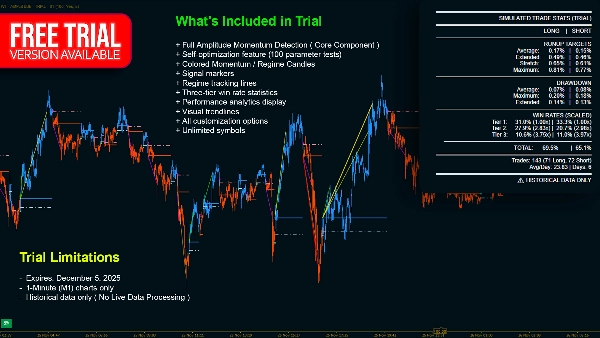
  5. OPTIMIZATION MODULE — with Self-Optimization Feature**


This creates an intelligent, self-adjusting indicator that delivers clarity, adaptability, and actionable trade zones—without constant manual tweaking.

** Test the FREE TRIAL VERSION and see the the Core Regime Detection and Optimization Module
** Please contact me after Purchase to GET FOR FREE the COMPLETE Optimization Module ( ! )

⎽⎽⎽⎽⎽⎽⎽⎽⎽⎽⎽⎽⎽⎽⎽⎽⎽⎽⎽⎽⎽⎽⎽⎽⎽⎽⎽⎽⎽⎽⎽⎽⎽⎽⎽⎽⎽⎽⎽⎽⎽⎽⎽⎽⎽⎽⎽⎽⎽⎽⎽⎽⎽⎽⎽⎽⎽⎽⎽⎽⎽⎽⎽⎽⎽⎽⎽⎽⎽⎽⎽⎽⎽⎽⎽⎽⎽⎽⎽⎽⎽⎽⎽⎽⎽⎽⎽⎽⎽⎽⎽⎽⎽⎽⎽⎽⎽⎽⎽⎽⎽⎽⎽⎽⎽⎽⎽⎽⎽⎽⎽⎽

Optimize Your Settings Automatically

⎽⎽⎽⎽⎽⎽⎽⎽⎽⎽⎽⎽⎽⎽⎽⎽⎽⎽⎽⎽⎽⎽⎽⎽⎽⎽⎽⎽⎽⎽⎽⎽⎽⎽⎽⎽⎽⎽⎽⎽⎽⎽⎽⎽⎽⎽⎽⎽⎽⎽⎽⎽⎽⎽⎽⎽⎽⎽⎽⎽⎽⎽⎽⎽⎽⎽⎽⎽⎽⎽⎽⎽⎽⎽⎽⎽⎽⎽⎽⎽⎽⎽⎽⎽⎽⎽⎽⎽⎽⎽⎽⎽⎽⎽⎽⎽⎽⎽⎽⎽⎽⎽⎽⎽⎽⎽⎽⎽⎽⎽⎽⎽

Experience a new approach to amplitude-based momentum analysis—smart, adaptive, and fast. Test it on any symbol in seconds with the FREE Trial Version showcasing the Amplitude Core Engine.

⎽⎽⎽⎽⎽⎽⎽⎽⎽⎽⎽⎽⎽⎽⎽⎽⎽⎽⎽⎽⎽⎽⎽⎽⎽⎽⎽⎽⎽⎽⎽⎽⎽⎽⎽⎽⎽⎽⎽⎽⎽⎽⎽⎽⎽⎽⎽⎽⎽⎽⎽⎽⎽⎽⎽⎽⎽⎽⎽⎽⎽⎽⎽⎽⎽⎽⎽⎽⎽⎽⎽⎽⎽⎽⎽⎽⎽⎽⎽⎽⎽⎽⎽⎽⎽⎽⎽⎽⎽⎽⎽⎽⎽⎽⎽⎽⎽⎽⎽⎽⎽⎽⎽⎽⎽⎽⎽⎽⎽⎽⎽⎽

What Is It?

⎽⎽⎽⎽⎽⎽⎽⎽⎽⎽⎽⎽⎽⎽⎽⎽⎽⎽⎽⎽⎽⎽⎽⎽⎽⎽⎽⎽⎽⎽⎽⎽⎽⎽⎽⎽⎽⎽⎽⎽⎽⎽⎽⎽⎽⎽⎽⎽⎽⎽⎽⎽⎽⎽⎽⎽⎽⎽⎽⎽⎽⎽⎽⎽⎽⎽⎽⎽⎽⎽⎽⎽⎽⎽⎽⎽⎽⎽⎽⎽⎽⎽⎽⎽⎽⎽⎽⎽⎽⎽⎽⎽⎽⎽⎽⎽⎽⎽⎽⎽⎽⎽⎽⎽⎽⎽⎽⎽⎽⎽⎽⎽

The Amplitude Momentum Labeler is a regime-detection indicator that pinpoints when the market enters or exits upward or downward momentum phases—in real time.


Unlike traditional moving-average crossovers, it measures actual momentum shifts by evaluating price displacement and reversal strength.


The Core Question

Is the market currently in a momentum phase—and in which direction?


To answer this, the indicator tracks:

  1. Amplitude — how far price has moved;
  2. Sequence — the order in which highs and lows occur.

A strong move followed by a meaningful reversal marks the beginning of a new momentum regime.

⎽⎽⎽⎽⎽⎽⎽⎽⎽⎽⎽⎽⎽⎽⎽⎽⎽⎽⎽⎽⎽⎽⎽⎽⎽⎽⎽⎽⎽⎽⎽⎽⎽⎽⎽⎽⎽⎽⎽⎽⎽⎽⎽⎽⎽⎽⎽⎽⎽⎽⎽⎽⎽⎽⎽⎽⎽⎽⎽⎽⎽⎽⎽⎽⎽⎽⎽⎽⎽⎽⎽⎽⎽⎽⎽⎽⎽⎽⎽⎽⎽⎽⎽⎽⎽⎽⎽⎽⎽⎽⎽⎽⎽⎽⎽⎽⎽⎽⎽⎽⎽⎽⎽⎽⎽⎽⎽⎽⎽⎽⎽⎽

How it Works

⎽⎽⎽⎽⎽⎽⎽⎽⎽⎽⎽⎽⎽⎽⎽⎽⎽⎽⎽⎽⎽⎽⎽⎽⎽⎽⎽⎽⎽⎽⎽⎽⎽⎽⎽⎽⎽⎽⎽⎽⎽⎽⎽⎽⎽⎽⎽⎽⎽⎽⎽⎽⎽⎽⎽⎽⎽⎽⎽⎽⎽⎽⎽⎽⎽⎽⎽⎽⎽⎽⎽⎽⎽⎽⎽⎽⎽⎽⎽⎽⎽⎽⎽⎽⎽⎽⎽⎽⎽⎽⎽⎽⎽⎽⎽⎽⎽⎽⎽⎽⎽⎽⎽⎽⎽⎽⎽⎽⎽⎽⎽⎽

1. Measure the Swing

The indicator constantly updates the highest and lowest price extremes.

Their difference—amplitude—defines the market’s current swing size.

2. Detect Reversal

- A sharp decline followed by a strong rally → **Upward momentum**

- A sharp rise followed by a strong decline → **Downward momentum**

3. Confirm Significance

Only reversals exceeding a volatility-adjusted threshold trigger a valid signal.

4. Detect Exhaustion

If price stops progressing, the indicator identifies momentum exhaustion and returns to neutral.

⎽⎽⎽⎽⎽⎽⎽⎽⎽⎽⎽⎽⎽⎽⎽⎽⎽⎽⎽⎽⎽⎽⎽⎽⎽⎽⎽⎽⎽⎽⎽⎽⎽⎽⎽⎽⎽⎽⎽⎽⎽⎽⎽⎽⎽⎽⎽⎽⎽⎽⎽⎽⎽⎽⎽⎽⎽⎽⎽⎽⎽⎽⎽⎽⎽⎽⎽⎽⎽⎽⎽⎽⎽⎽⎽⎽⎽⎽⎽⎽⎽⎽⎽⎽⎽⎽⎽⎽⎽⎽⎽⎽⎽⎽⎽⎽⎽⎽⎽⎽⎽⎽⎽⎽⎽⎽⎽⎽⎽⎽⎽⎽

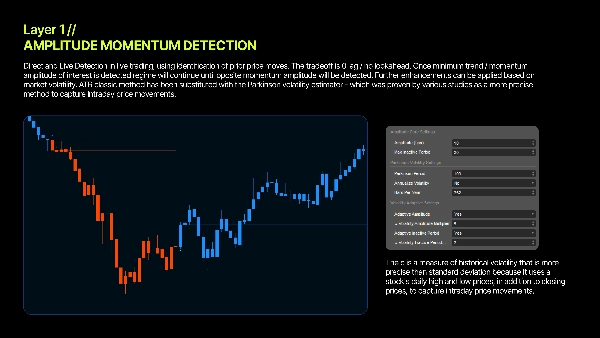
Parkinson Volatility — Adaptive Thresholds

⎽⎽⎽⎽⎽⎽⎽⎽⎽⎽⎽⎽⎽⎽⎽⎽⎽⎽⎽⎽⎽⎽⎽⎽⎽⎽⎽⎽⎽⎽⎽⎽⎽⎽⎽⎽⎽⎽⎽⎽⎽⎽⎽⎽⎽⎽⎽⎽⎽⎽⎽⎽⎽⎽⎽⎽⎽⎽⎽⎽⎽⎽⎽⎽⎽⎽⎽⎽⎽⎽⎽⎽⎽⎽⎽⎽⎽⎽⎽⎽⎽⎽⎽⎽⎽⎽⎽⎽⎽⎽⎽⎽⎽⎽⎽⎽⎽⎽⎽⎽⎽⎽⎽⎽⎽⎽⎽⎽⎽⎽⎽⎽

Most indicators use fixed parameters. This one adapts automatically. By using Parkinson Volatility—which incorporates intraday high/low ranges—the indicator adjusts sensitivity based on real market conditions. The result: consistent performance across quiet and volatile environments. ( Statistically proven more efficient than ATR Method )

⎽⎽⎽⎽⎽⎽⎽⎽⎽⎽⎽⎽⎽⎽⎽⎽⎽⎽⎽⎽⎽⎽⎽⎽⎽⎽⎽⎽⎽⎽⎽⎽⎽⎽⎽⎽⎽⎽⎽⎽⎽⎽⎽⎽⎽⎽⎽⎽⎽⎽⎽⎽⎽⎽⎽⎽⎽⎽⎽⎽⎽⎽⎽⎽⎽⎽⎽⎽⎽⎽⎽⎽⎽⎽⎽⎽⎽⎽⎽⎽⎽⎽⎽⎽⎽⎽⎽⎽⎽⎽⎽⎽⎽⎽⎽⎽⎽⎽⎽⎽⎽⎽⎽⎽⎽⎽⎽⎽⎽⎽⎽⎽

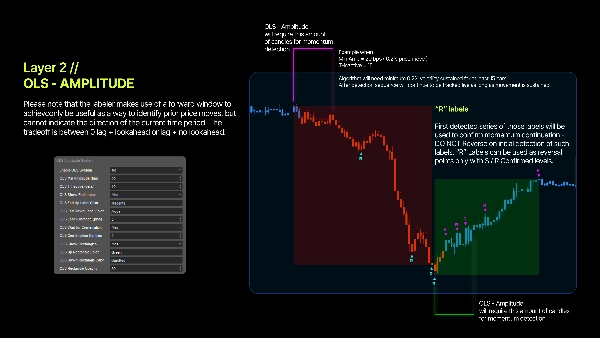
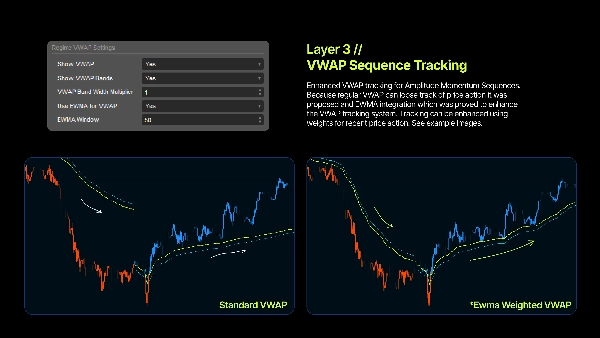
Regime VWAP — Dynamic Levels for Re-Entry

⎽⎽⎽⎽⎽⎽⎽⎽⎽⎽⎽⎽⎽⎽⎽⎽⎽⎽⎽⎽⎽⎽⎽⎽⎽⎽⎽⎽⎽⎽⎽⎽⎽⎽⎽⎽⎽⎽⎽⎽⎽⎽⎽⎽⎽⎽⎽⎽⎽⎽⎽⎽⎽⎽⎽⎽⎽⎽⎽⎽⎽⎽⎽⎽⎽⎽⎽⎽⎽⎽⎽⎽⎽⎽⎽⎽⎽⎽⎽⎽⎽⎽⎽⎽⎽⎽⎽⎽⎽⎽⎽⎽⎽⎽⎽⎽⎽⎽⎽⎽⎽⎽⎽⎽⎽⎽⎽⎽⎽⎽⎽⎽

Once a regime is active, the indicator computes a VWAP specific to that trend, providing Dynamic Support and Dynamic Resistance Levels. Institutions rely heavily on VWAP, and price often reacts around it—making it ideal for pullback entries.


EWMA Mode

Enable EWMA to weight recent prices more heavily, creating a smoother, more responsive VWAP curve. Excellent for identifying re-entries during extended trends.

⎽⎽⎽⎽⎽⎽⎽⎽⎽⎽⎽⎽⎽⎽⎽⎽⎽⎽⎽⎽⎽⎽⎽⎽⎽⎽⎽⎽⎽⎽⎽⎽⎽⎽⎽⎽⎽⎽⎽⎽⎽⎽⎽⎽⎽⎽⎽⎽⎽⎽⎽⎽⎽⎽⎽⎽⎽⎽⎽⎽⎽⎽⎽⎽⎽⎽⎽⎽⎽⎽⎽⎽⎽⎽⎽⎽⎽⎽⎽⎽⎽⎽⎽⎽⎽⎽⎽⎽⎽⎽⎽⎽⎽⎽⎽⎽⎽⎽⎽⎽⎽⎽⎽⎽⎽⎽⎽⎽⎽⎽⎽⎽

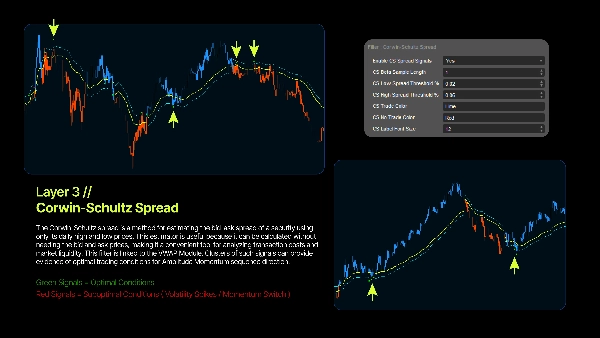
Roll Spread Estimator - Dynamic Filter for Re-Entry

⎽⎽⎽⎽⎽⎽⎽⎽⎽⎽⎽⎽⎽⎽⎽⎽⎽⎽⎽⎽⎽⎽⎽⎽⎽⎽⎽⎽⎽⎽⎽⎽⎽⎽⎽⎽⎽⎽⎽⎽⎽⎽⎽⎽⎽⎽⎽⎽⎽⎽⎽⎽⎽⎽⎽⎽⎽⎽⎽⎽⎽⎽⎽⎽⎽⎽⎽⎽⎽⎽⎽⎽⎽⎽⎽⎽⎽⎽⎽⎽⎽⎽⎽⎽⎽⎽⎽⎽⎽⎽⎽⎽⎽⎽⎽⎽⎽⎽⎽⎽⎽⎽⎽⎽⎽⎽⎽⎽⎽⎽⎽⎽

A roll spread estimator is a method for estimating the bid-ask spread from observed trade prices, typically using the serial covariance of price changes. Developed by Roll, it assumes that successive trades alternate between the bid and ask prices, and new information is not constantly moving the "true" price. While simple and foundational, the original method has been refined to address issues like downward bias and poor performance in certain datasets. The estimator is based on the idea that if no new information is released, prices will simply bounce between the bid and ask. It assumes an equal probability of a buy-initiated and a sell-initiated trade.

⎽⎽⎽⎽⎽⎽⎽⎽⎽⎽⎽⎽⎽⎽⎽⎽⎽⎽⎽⎽⎽⎽⎽⎽⎽⎽⎽⎽⎽⎽⎽⎽⎽⎽⎽⎽⎽⎽⎽⎽⎽⎽⎽⎽⎽⎽⎽⎽⎽⎽⎽⎽⎽⎽⎽⎽⎽⎽⎽⎽⎽⎽⎽⎽⎽⎽⎽⎽⎽⎽⎽⎽⎽⎽⎽⎽⎽⎽⎽⎽⎽⎽⎽⎽⎽⎽⎽⎽⎽⎽⎽⎽⎽⎽⎽⎽⎽⎽⎽⎽⎽⎽⎽⎽⎽⎽⎽⎽⎽⎽⎽⎽

Usage Benefits

⎽⎽⎽⎽⎽⎽⎽⎽⎽⎽⎽⎽⎽⎽⎽⎽⎽⎽⎽⎽⎽⎽⎽⎽⎽⎽⎽⎽⎽⎽⎽⎽⎽⎽⎽⎽⎽⎽⎽⎽⎽⎽⎽⎽⎽⎽⎽⎽⎽⎽⎽⎽⎽⎽⎽⎽⎽⎽⎽⎽⎽⎽⎽⎽⎽⎽⎽⎽⎽⎽⎽⎽⎽⎽⎽⎽⎽⎽⎽⎽⎽⎽⎽⎽⎽⎽⎽⎽⎽⎽⎽⎽⎽⎽⎽⎽⎽⎽⎽⎽⎽⎽⎽⎽⎽⎽⎽⎽⎽⎽⎽⎽

1. Objective Trend Identification - No trendlines. No guesswork. The math defines the regime.

2. Volatility Adaptive - Automatically adjusts to changing conditions using Parkinson Volatility.

3. Clear Entry Zones - Regime VWAP levels help pinpoint intuitive pullback and add-on areas.

4. Defined Regime Boundaries - Know exactly when momentum begins and when it ends.

5. Multi-Timeframe Compatibility - Basis-point normalization ensures consistent behavior on any chart.

⎽⎽⎽⎽⎽⎽⎽⎽⎽⎽⎽⎽⎽⎽⎽⎽⎽⎽⎽⎽⎽⎽⎽⎽⎽⎽⎽⎽⎽⎽⎽⎽⎽⎽⎽⎽⎽⎽⎽⎽⎽⎽⎽⎽⎽⎽⎽⎽⎽⎽⎽⎽⎽⎽⎽⎽⎽⎽⎽⎽⎽⎽⎽⎽⎽⎽⎽⎽⎽⎽⎽⎽⎽⎽⎽⎽⎽⎽⎽⎽⎽⎽⎽⎽⎽⎽⎽⎽⎽⎽⎽⎽⎽⎽⎽⎽⎽⎽⎽⎽⎽⎽⎽⎽⎽⎽⎽⎽⎽⎽⎽⎽

The Quantitative Foundation

⎽⎽⎽⎽⎽⎽⎽⎽⎽⎽⎽⎽⎽⎽⎽⎽⎽⎽⎽⎽⎽⎽⎽⎽⎽⎽⎽⎽⎽⎽⎽⎽⎽⎽⎽⎽⎽⎽⎽⎽⎽⎽⎽⎽⎽⎽⎽⎽⎽⎽⎽⎽⎽⎽⎽⎽⎽⎽⎽⎽⎽⎽⎽⎽⎽⎽⎽⎽⎽⎽⎽⎽⎽⎽⎽⎽⎽⎽⎽⎽⎽⎽⎽⎽⎽⎽⎽⎽⎽⎽⎽⎽⎽⎽⎽⎽⎽⎽⎽⎽⎽⎽⎽⎽⎽⎽⎽⎽⎽⎽⎽⎽

Logarithmic Returns

Using log returns ensures symmetry, making momentum measurement mathematically robust.

Basis Points

All calculations use standardized bps units (1 bps = 0. 01%), allowing cross-asset consistency.

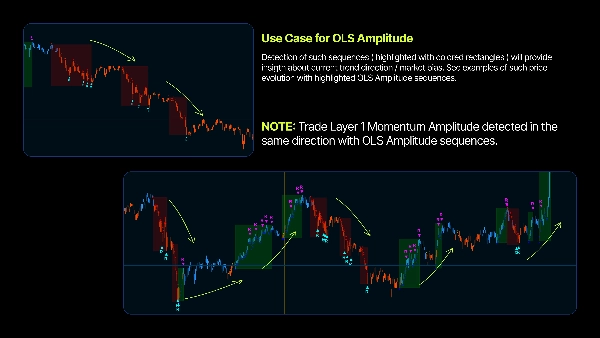
Retracement Detection

Momentum shifts are identified through strong directional moves followed by meaningful counter-moves (V-shaped reversals).

Synthetic Volume

Range and body-based synthetic volume ensures VWAP accuracy for any symbol.

⎽⎽⎽⎽⎽⎽⎽⎽⎽⎽⎽⎽⎽⎽⎽⎽⎽⎽⎽⎽⎽⎽⎽⎽⎽⎽⎽⎽⎽⎽⎽⎽⎽⎽⎽⎽⎽⎽⎽⎽⎽⎽⎽⎽⎽⎽⎽⎽⎽⎽⎽⎽⎽⎽⎽⎽⎽⎽⎽⎽⎽⎽⎽⎽⎽⎽⎽⎽⎽⎽⎽⎽⎽⎽⎽⎽⎽⎽⎽⎽⎽⎽⎽⎽⎽⎽⎽⎽⎽⎽⎽⎽⎽⎽⎽⎽⎽⎽⎽⎽⎽⎽⎽⎽⎽⎽⎽⎽⎽⎽⎽⎽

This tool is for educational and informational purposes only. It is not investment advice. Trading involves risk, and losses can exceed deposits. Past performance does not guarantee future results. You are solely responsible for all trading decisions. The creator is not liable for any financial losses arising from the indicator’s use. Always perform your own analysis before trading.

5.0
Reviews: 1
5
100 %
4
0 %
3
0 %
2
0 %
1
0 %
Customer reviews
November 30, 2025
WT - Amplitude-Momentum Detection highlights bars with significant volatility or movement - great for spotting potential entries or breakout points. Lightweight, clear, and effective across timeframes. Best used with filters (volume, structure), but as a first-level radar, it does the job cleanly.
More from this author
Indicator
NAS100
NZDUSD
XAUUSD
+11
WT - RR Tool
Lightweight Risk-Reward Visualization Tool.
cBot
NAS100
Indices
Prop
+9
WT - Hotkeys - Trade Panel
Turn Your Keyboard into a Trading Console — Instant Entries, Exits, and Precision Risk Control.
Indicator
NAS100
NZDUSD
Breakout
+14
WT - Tick Imbalance Bars
Tick Imbalance Bars Indicator - brings institutional-grade market microstructure analysis to cTrader.
Indicator
NAS100
NZDUSD
XAUUSD
+12
WT - PJER
Price Jump Exit & Re-Entry Indicator - Statistical boundaries that adapt to real-time volatility.
Indicator
NAS100
NZDUSD
Breakout
+12
WT - Composite Index
Combines multiple Currency Pairs / Symbols into a single Weighted Average Strength of that currency.
Indicator
NAS100
Breakout
XAUUSD
+12
WT - Tick Volume Bars
Volume Imbalance Bars Indicator - brings institutional-grade market microstructure analysis to cTrader.
Indicator
NAS100
NZDUSD
XAUUSD
+12
WT - Hawkes Process
Identifies market compression zones and explosive Breakout moments using mathematical modeling.
You may also like
Indicator
NAS100
NZDUSD
Martingale
+26
Smart Money Gaps
Smart Money Gaps: MTF FVG auto-detection, extension, and mitigation marker. Trade institutional imbalances.
Indicator
VWAP
ZigZag
Weis & Wyckoff System v2.0
Indicator
Grid
NAS100
NZDUSD
+15
RangeBoxFibonacci
With this Fibonacci retracement indicator, traders have full control over the retracement levels displayed on the chart.
VegaXLR - cTrader Multi-Timeframe Pivot Pro
Customizable multi-timeframe pivot point indicator for cTrader with alerts, Fibonacci, CPR, and more!
Indicator
RSI
Breakout
Supertrend
Market Trend OB
Price action to detect when the market changes trend (MSB) and defines, order blocks , ZigZag etc.📊
Indicator
Indices
Prop
Breakout
+3
RVI
A precision-crafted indicator that compares current volume to its historical average for the same time of day.
Indicator
FVG
Fibonacci
Fair Value Gap (Extended)
Detect FVGs with age, status, Fibonacci levels, and customizable fill threshold—extended version.
Rsi buy Sell Signal
Instant‑setup RSI scalper—designed for turbulent markets.
Indicator
NAS100
XAUUSD
Forex
+4
MACD Indicator NDH
MACD Indicator with Histogram that plots Colors Based on Direction Above and Below the Zero Line.
Multi Volume Profile
Advanced customizable volume-profile indicator with buy/sell levels, delta analysis, multi-TF support and vivid gradient
VWAP-Free
VWAP only timeframe
Indicator
NAS100
NZDUSD
Breakout
+18
Free Smart Money Concepts (SMC) from TradingView
Free Smart Money Concepts from TradingView for cTrader: BOS/CHoCH, OB, FVG, liquidity, MTF levels, discount zones.
DMI MONDAY ZONES v2.1
Marks Monday's OPEN,HIGH & LOW. These are areas of support and resistance for the week.
Indicator
NAS100
NZDUSD
Martingale
+26
Volume Delta
Read aggressive flow in real time. Flexible resets (Day/Week/Month), optional EMA smoothing, and non-repainting cumulati
Indicator
Breakout
AutoLines™ Support & Resistance
FlexSR auto‑detects pivot highs/lows to plot dynamic support & resistance lines Features customizable styling and option
SmartFibonacci
SmartFibonacci — automatic Fibonacci retracements & extensions with swing detection, alerts and clean labels for cTrader
Indicator
Scalping
Kaufman Adaptive MA with Trend Vision
Adaptive KAMA: fast in trend, slow in noise — with color-coded market state visualization.
Indicator
NAS100
RSI
NZDUSD
+18
HAIQuantum-V10
The HAI Quantum V10 is an advanced indicator designed for technical analysis