
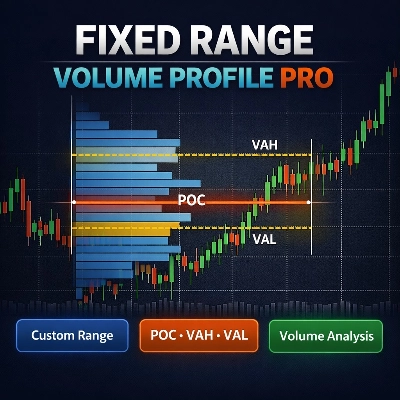
Fixed Range Volume Profile - FRVP
Indicator
3 purchases
Version 1.0, Mar 2026
Windows, Mac
4.5
Reviews: 2
Since 27/10/2025
2
Sales
Description
Fixed Range Volume Profile Pro
This indicator is built for traders who want a simple way to see where volume actually matters.
Instead of guessing support and resistance, you can define a range and instantly see where the market has been spending most of its time. It highlights the key levels: POC, VAH, and VAL, so you can focus on areas that are more likely to react.
What it shows
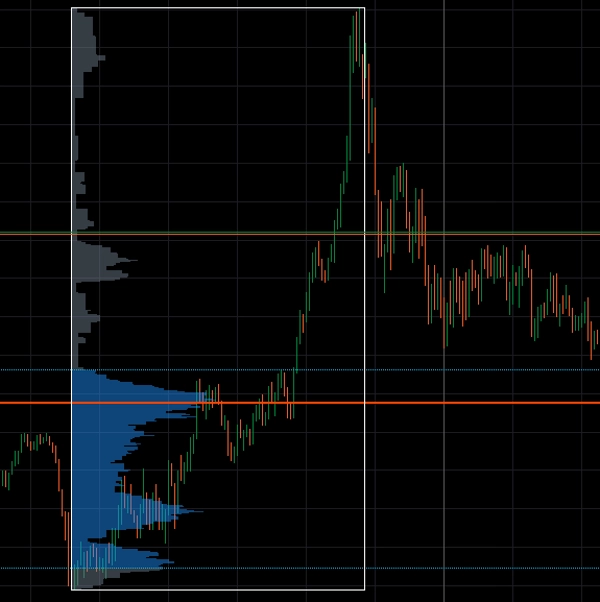
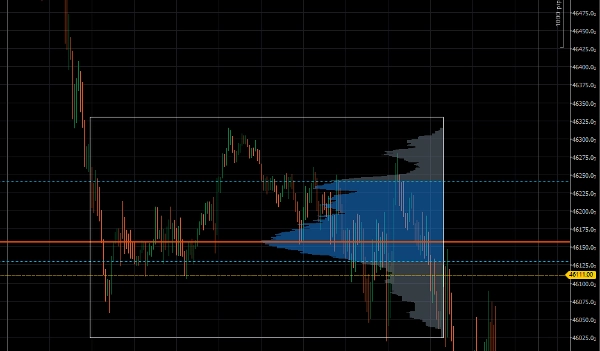
Once you select a range, the indicator builds a volume profile based on that section of the chart.
It highlights:
- POC (Point of Control)
The price where the most volume was traded. This level often acts as a magnet. - VAH (Value Area High)
The upper boundary of where most trading activity happened. - VAL (Value Area Low)
The lower boundary of that same value area.
These levels help you quickly see:
- Where price is “fair”
- Where it might reverse
- Where breakouts could happen
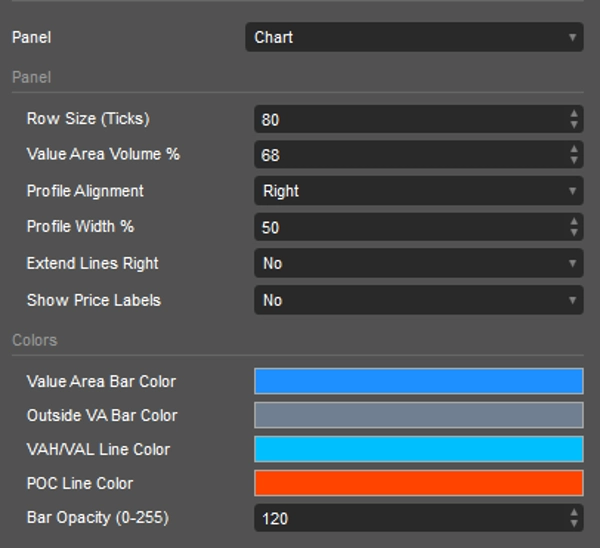
Settings:
- Row Size (Ticks)
Controls how detailed the profile is
Lower = more detail, Higher = smoother - Value Area Volume % (default 68)
Defines how much of the volume is considered “value” - Profile Alignment
Moves the profile to the left or right side - Profile Width %
Adjusts how wide the histogram looks - Extend Lines Right
Keeps POC / VAH / VAL visible into future price - Show Price Labels
Displays exact price levels
Who this is for:
- Scalpers looking for precise levels
- Intraday traders (US30, NASDAQ, Forex)
- Anyone used to TradingView’s fixed range tool
Final note
This works best when combined with price action.
It won’t give you signals or tell you when to enter but it will show you where it makes sense to pay attention.
Summary
AI summary
Fixed Range Volume Profile (FRVP) is a trading indicator designed to display volume distribution within a user-defined price range on a chart. It highlights key volume-based levels: Point of Control (POC), where the highest volume traded; Value Area High (VAH), the upper boundary of significant trading volume; and Value Area Low (VAL), the lower boundary. These levels help traders identify fair price areas, potential reversal points, and breakout zones.
Users select a specific range on the chart, and the indicator generates a volume profile histogram for that segment. Adjustable settings include row size (tick granularity), value area volume percentage (default 68%), profile alignment, histogram width, line extension into future price, and price label display.
FRVP is suitable for scalpers, intraday traders, and those familiar with TradingView’s fixed range volume profile tool. It supports various markets including Forex, indices, commodities, stocks, and cryptocurrencies. The indicator does not provide trade signals but serves as a visual tool to focus attention on important volume levels when combined with price action analysis.
Users select a specific range on the chart, and the indicator generates a volume profile histogram for that segment. Adjustable settings include row size (tick granularity), value area volume percentage (default 68%), profile alignment, histogram width, line extension into future price, and price label display.
FRVP is suitable for scalpers, intraday traders, and those familiar with TradingView’s fixed range volume profile tool. It supports various markets including Forex, indices, commodities, stocks, and cryptocurrencies. The indicator does not provide trade signals but serves as a visual tool to focus attention on important volume levels when combined with price action analysis.
Indicator profile
Customer reviews
4.5
Reviews: 2
5 | 50 % | |
4 | 50 % | |
3 | 0 % | |
2 | 0 % | |
1 | 0 % |
Discussion
FAQ
BTCUSD
Forex
Signal
Breakout
Indices
EURUSD
Commodities
GBPUSD
NZDUSD
Martingale
Prop
Scalping
SMC
Crypto
Grid
Stocks
AI
XAUUSD
NAS100
USDJPY
VWAP
Products available through cTrader Store, including trading bots, indicators and plugins, are provided by third-party developers and made available for informational and technical access purposes only. cTrader Store is not a broker and does not provide investment advice, personal recommendations or any guarantee of future performance.

















Price
Since 27/10/2025
2
Sales