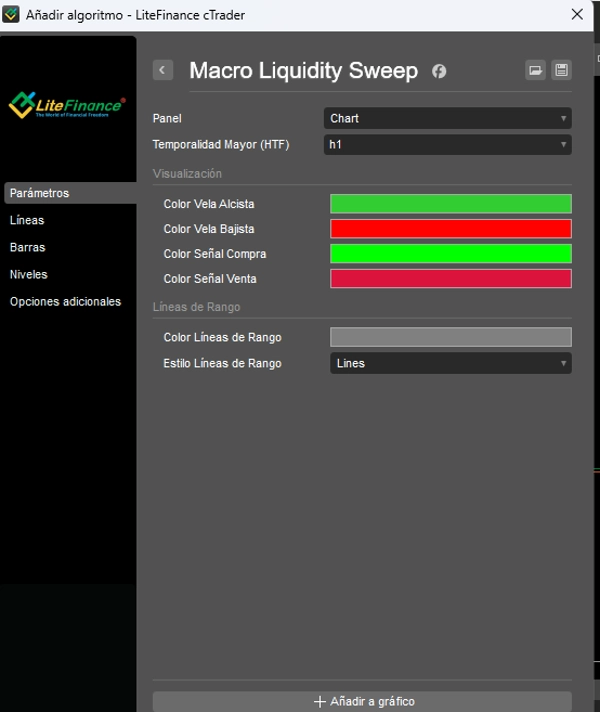
Description
CRT Sweep Tracker is a highly advanced Multi-Timeframe trading panel engineered specifically for Candle Range Theory (CRT) practitioners and Smart Money traders.
In CRT, profitability comes from identifying a reference candle, waiting for the market to manipulate (sweep) its extremes, and catching the subsequent distribution. This indicator automates that exact analytical process, monitoring your Higher Timeframe (HTF) for high-probability sweeps and projecting the trade management visually onto your current chart.
⚙️ The CRT Engine
The algorithm constantly monitors your selected HTF to identify valid CRT setups:
- The Range Sweep: It tracks the Highs and Lows of the previous HTF candles. It alerts you the moment a new candle breaks these structural extremes to grab liquidity.
- The Rejection: It confirms the setup only if the sweeping candle fails to displace, closing back inside the previous candle's range.
- The Logical Filter: Before activating a signal, the engine calculates the strict distance to the structural Stop Loss and Take Profit, ensuring the setup offers a mathematical Risk:Reward ratio of 1:1 or better.
📊 Dynamic Floating Trade Manager
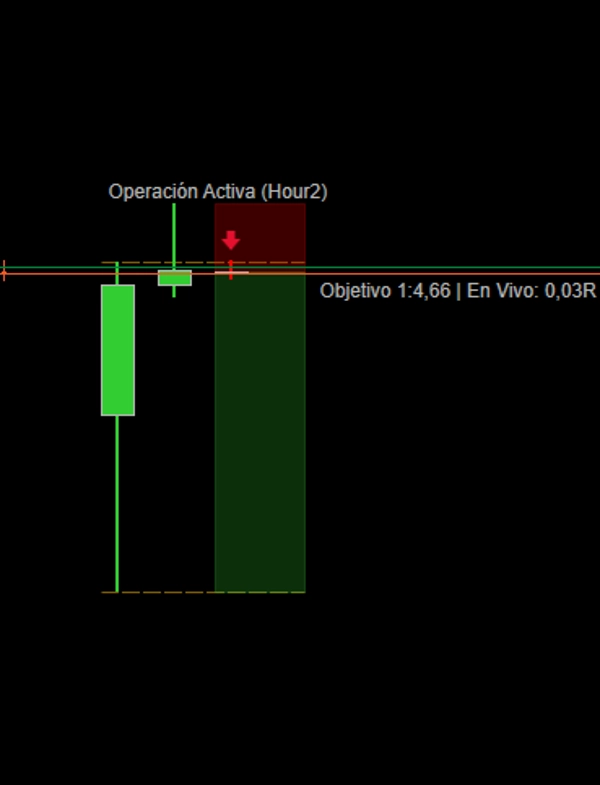
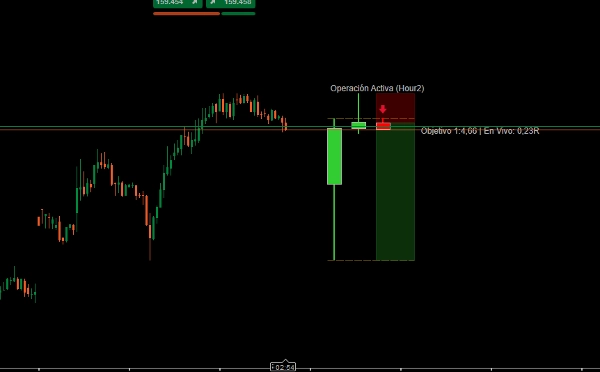
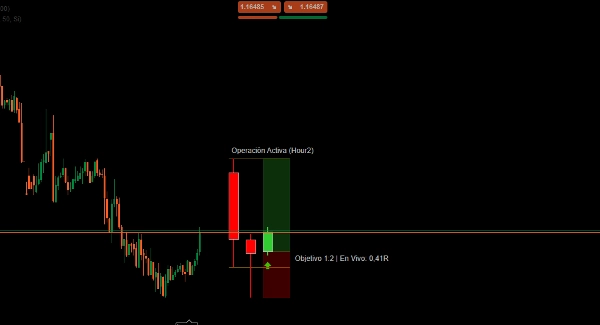
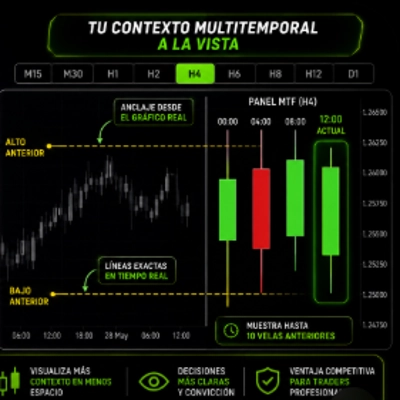
Once a valid CRT sweep is confirmed, a dynamic floating widget appears directly on your execution chart. It plots the HTF candles tick-by-tick, alongside professional trade management visuals:
- Live Risk/Reward Zones: Instantly plots the Stop Loss (Red Zone) and Take Profit (Green Zone) based on the swept HTF candle's structure.
- Real-Time 'R' Tracking: A live data label calculates your exact floating PnL in 'R' multiples (Risk units). You know exactly how the macro trade is performing while you execute on the micro timeframe.
- Auto-Reset: The floating manager stays active until the price hits the structural SL or TP, cleanly resetting itself for the next CRT cycle.
🛠️ Key Features & Settings
- Custom HTF Selection: Seamlessly monitor H4 or H1 sweeps while executing your entries on the M15 or M5 charts.
- Smart Canvas Optimization: The floating widget only draws the necessary active candles and cleans up historical data automatically, keeping your terminal clutter-free.
- Full Aesthetic Control: Customize the colors of the floating bullish/bearish candles, signal arrows, risk/reward zones, and range lines to perfectly match your charting template.
Summary
The indicator’s core algorithm monitors HTF candle extremes to detect range sweeps—price moves that break previous HTF highs or lows to capture liquidity. It confirms setups by identifying rejection candles that close back inside the prior candle’s range. A logical filter ensures signals meet a minimum risk-to-reward ratio of 1:1 before activation.
Upon confirmation, a dynamic floating trade manager widget appears on the chart, displaying tick-by-tick HTF candle data alongside key trade management visuals. These include live risk/reward zones (stop loss and take profit), real-time profit and loss tracking in risk multiples (“R”), and automatic reset after trade completion.
Users can customize the HTF selection and visual elements such as candle colors, signal arrows, and risk zones. The widget optimizes chart space by showing only active candles and clearing historical data automatically. This tool supports structured CRT trading by visually integrating macro liquidity sweep analysis with micro timeframe trade management.
Discussion
Customer reviews
5 | 0 % | |
4 | 100 % | |
3 | 0 % | |
2 | 0 % | |
1 | 0 % |














!["Smart Money Concepts (SMC) [Iridio Capital]" logo](https://cdn.ctrader.com/image/webp/b4b5414d-a5ca-44b7-a947-e28eca44a218_61548)