Description
Whale Liquidity & Absorption Profile
Track institutional money, analyze order flow, and spot reversal zones with volumetric precision
The Whale Liquidity & Absorption Profile is not your traditional volume profile. It is a market microstructure analysis suite that breaks down every transaction to show you not only where volume was traded, but who traded it (institutional vs. retail) and how price interacted at those levels (aggression vs. absorption).
It features an optimized rendering engine that projects all data to the right of the current price, keeping your chart completely clean and lag-free.
Key Features
- Strength Filter (Whales Only): Uses a percentile algorithm (e.g., top 97%) to separate institutional ("Strong") volume from retail ("Weak") volume. You can toggle the "Strong Only" mode to exclusively track the footprint of smart money.
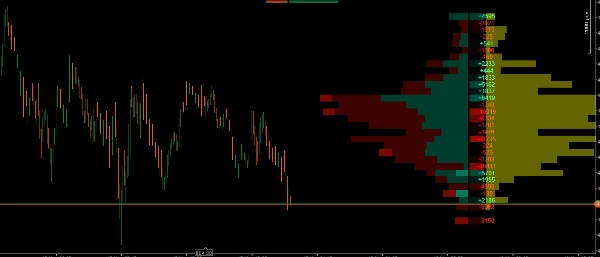
- Stacked Volume Profile: Visually displays the distribution of bullish and bearish volume per price level, making it easy to identify the Point of Control (POC) and High/Low Volume Nodes (HVN/LVN).
- Automatic Value Area Detection: Highlights the price levels where the highest percentage of volume has been traded (default 70%), dimming the outer zones to easily read market context at a glance.
- Delta Profile (Heatmap): Calculates the exact difference between market buys and market sells at each price level. It includes numerical values and a visual heatmap to quickly spot who is aggressively in control.
- Absorption Profile (Yellow Zones): Measures the volume trapped specifically within candlestick wicks. This allows you to graphically see exactly where smart money is passively absorbing liquidity from trapped retail traders.
- Optimized Performance: Heavy volumetric calculations are only processed on the latest candle, ensuring your cTrader platform runs smoothly and efficiently, even on lower timeframes.
How to use this indicator in your trading?
This indicator provides 3 layers of confirmation for your trades. Here is how to combine them effectively:
1. Define the Context with the Volume Profile & Value Area
- Use the volume profile to identify where price acceptance is highest (Value Area and POC).
- Strategy: Look for buying opportunities at the bottom of the Value Area (Support) and selling opportunities at the top of the Value Area (Resistance).
2. Evaluate Aggression with the Delta Profile
- When price reaches your key level (e.g., a support zone), look at the Delta column.
- Strategy: If you are looking for a buy at support, you want to see a strongly positive (green) Delta at that level, indicating buyers are aggressively stepping in. If the Delta remains heavily negative, sellers are still dominating.
3. Find the Perfect Trigger with the Absorption Profile (The core of the indicator)
- This is where the tool truly shines. Often, the market looks like it's dropping hard (strong negative Delta), yet the price stops falling. Why? Because the "whales" are using limit orders to absorb all that selling pressure.
- Strategy (Reversal Trade): If you see the price dropping into a critical level and the Delta is negative (trapped retail sellers), but suddenly a large yellow bar appears in the Absorption Profile, it means institutions have just absorbed all the liquidity in that wick. This is your optimal trigger to enter in the opposite direction!
4. Use the "Strength Filter" to Cut Through the Noise
- If the market is consolidating and direction is unclear, turn on the "Strong Only" option. This will hide all irrelevant retail noise and show you exactly where large funds are accumulating or distributing their positions.
Summary
A Delta Profile heatmap calculates the net difference between market buys and sells at each price level, showing buyer or seller aggression. The Absorption Profile identifies volume trapped in candlestick wicks, revealing where institutional traders absorb liquidity from retail participants. The indicator’s optimized engine processes heavy volumetric calculations only on the latest candle, ensuring smooth performance on the cTrader platform.
Traders can use this tool to define market context, evaluate buying or selling aggression, and pinpoint reversal triggers based on absorption patterns. The "Strong Only" mode filters out retail noise during consolidation phases, focusing on institutional accumulation or distribution zones. This indicator supports volume and DOM data visualization to enhance decision-making around key support and resistance levels.
Customer reviews
5 | 100 % | |
4 | 0 % | |
3 | 0 % | |
2 | 0 % | |
1 | 0 % |