R S
"R S" logo
09/08/2025
25
Desktop
Since 31/12/2024
Sales
3
Free installs
403
"R S" uploaded image"R S" uploaded image"R S" uploaded image"R S" uploaded image
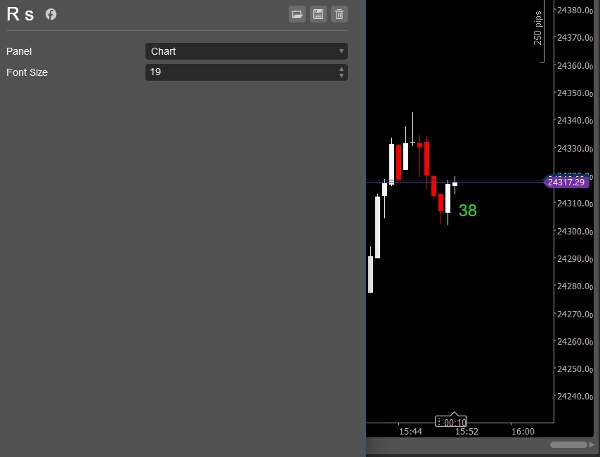
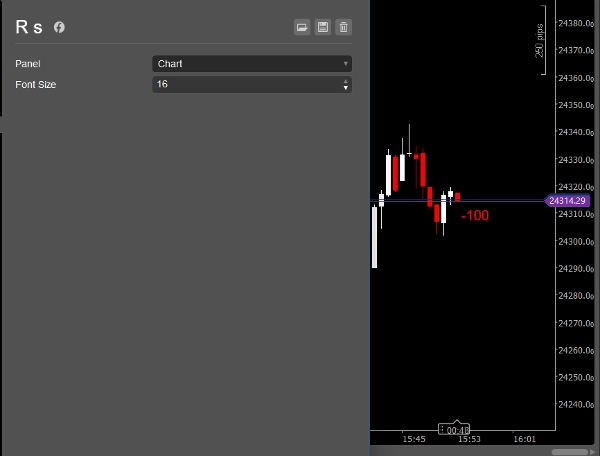
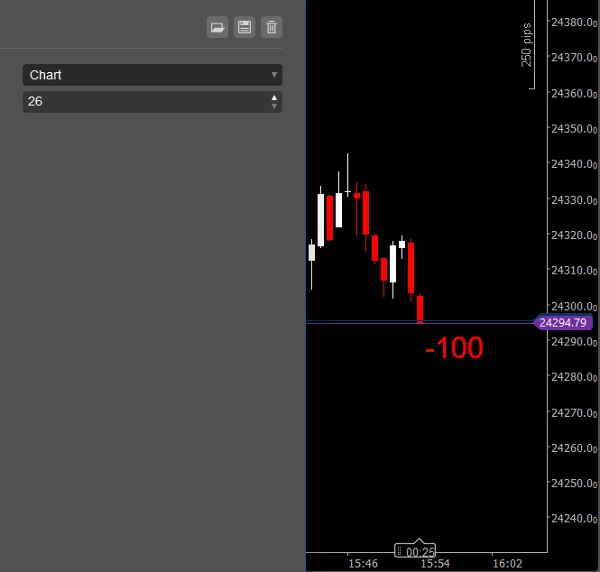
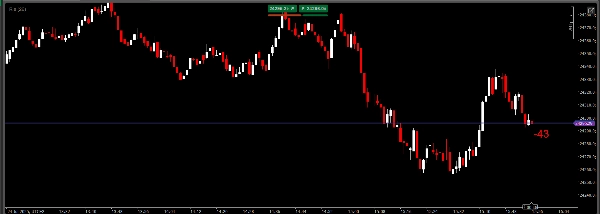
  • This indicator is a simple, single-timeframe tool for showing candle sentiment directly on your chart.
    If you want a more advanced, multi-timeframe solution with professional features, check out my other products:
  • Candle Timer & Strength – see candle timers and strength on multiple timeframes, right next to the price.
  • Candle Timer & Strength Panel – always-visible dashboard with timers and candle strength for up to 5 timeframes, fixed at the top of your chart.
  • ZigZag Pro – advanced swing and market structure indicator, perfect for combining with sentiment tools.

Combine Candle Timer & Strength Panel with ZigZag Pro for a complete view of market sentiment, timing, and structure!

Find all my indicators and bots here:
https://ctrader.com/pl?search=kobud.222&u=kobud.222

http://www.youtube.com/@Robi22-22

📩 Questions? Suggestions? Discount?
Contact available in my profile: Robikobud


0.0
Reviews: 0
Customer reviews
No reviews for this product yet. Already tried it? Be the first to tell others!
More from this author
Candle Timer & Strength Demo
Candle Timer & Strength DEMO for cTrader This is a DEMO version of the Candle Timer & Strength indicator. You can use al
Candle Timer & Strength Panel Demo -
Candle Timer & Strength Panel DEMO for cTrader DEMO VERSION – 24 hours free trial! This is a DEMO version of the Candle
ZigZagSmartAlert_demo
ZigZag Smart Alert DEMO for cTrader DEMO VERSION 24 hours free trial! This is a DEMO version of the ZigZag Smart Aler
Zig zag v.1 Demo
ZigZag Pro DEMO – Multi-Swing Indicator for cTrader DEMO VERSION – 24 hours free trial! This is a DEMO version of the Z
Trading_stop Demo
Trading_stop DEMO for cTrader Description: Trading_stop is a fast, lightweight trailing stop panel for cTrader, designed
Trading_stop Plus DEMO
📄 Trading_stop Plus DEMO 🧪 DEMO VERSION – LIMITED TO 48 HOURS This is the demo version of Trading_stop Plus. It works
TraderMaxBBflterXDemo-
TraderMax BB Filter X (DEMO) for cTrader 🧪 Limited-Time Demo Version (24h) TraderMax BB Filter X (DEMO) is a precision
You may also like
Multi Volume Profile
Advanced customizable volume-profile indicator with buy/sell levels, delta analysis, multi-TF support and vivid gradient
Indicator
Indices
RSI
Bollinger
Clustering
Clustering tool for traders with visual insights into market patterns.
Indicator
Scalping
ACTO-v1
ACTO: Oscillator tracking average candle duration to anticipate volatility shifts in trading.
SmartLiquidityZonesPRO
Smart Liquidity Zones PRO auto-detects liquidity grabs, wicks, traps & manipulations — trade like the smart money.
Indicator
Stocks
Forex
Crypto
Trend Angle Indicator [Iridio Capital]
The Trend Angle Indicator provides a clear and intuitive way to visualize market trends.
Indicator
Indices
RSI
Commodities
+1
OrderPrice-V3
A straightforward yet effective tool signals entry points for both buying and selling. Include 3 Moving Average
Indicator
NAS100
NZDUSD
Martingale
+23
Elliott Waves Auto Detection + Fibonacci
Auto-detect Elliott 1–5 & a–b–c waves with smart Fib zones, boxed labels, and breakout boxes—ready to trade.
Indicator
Grid
NAS100
NZDUSD
+15
RangeBoxFibonacci
With this Fibonacci retracement indicator, traders have full control over the retracement levels displayed on the chart.
smma tel
Wstęgi HTS 33 144 mobile
Insider_CumulativeDelta
Robust Cumulative delta,Atr and imbalance indicator.
Indicator
RSI
Breakout
XAUUSD
+5
Prime Trend Targets
PrimeTrend: ATR trendline detects reversals, plots entry/SL/3 targets. Tune params (speed vs. robustness). Backtest +
Indicator
NAS100
NZDUSD
Martingale
+26
Info Dashboard_noSourceCode
Read the market with AI: live sentiment, news impact, equity, spread & neural net signals in one dashboard.
Indicator
Commodities
Forex
Compra e Venda
Indicador Compra e Venda é um rastreador de tendência.
pATR
An indicator that redefines ATR by applying a percentile-based filter giving traders a grounded view of volatility.
Indicator
Indices
RSI
XAUUSD
+9
RT Stochastic RSI PRO
Unlock Stochastic RSI PRO in cTrader! Overlay RSI, highlight zones, and identify divergences with customizable settings.
Market Polarity Zones
implifies market analysis by automatically identifying bullish 🚀 or bearish 🐻 phases and marking key levels where ....
Indicator
RSI
XAUUSD
Breakout
+5
Dynamic Range MomentumI
This histogram helps visualize the strength and direction of market movements, making it easier to spot potential trends