
Candle Timer & Strength Demo
Indicator
267 downloads
Version 1.0, Jul 2025
Windows, Mac
Description
Key Features:
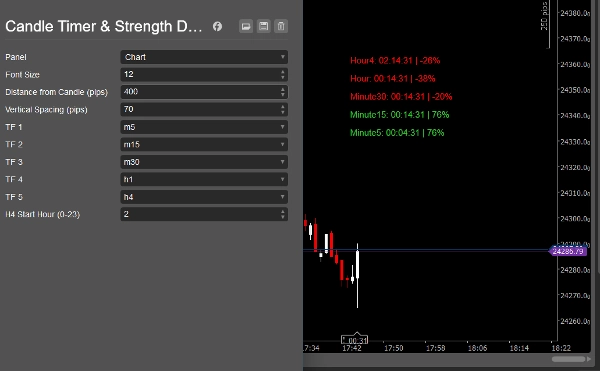
- Multi-Timeframe Candle Timers:
See the countdown to the next candle close on up to 5 selected timeframes, all in one clear panel. - Candle Strength in %:
Instantly view the strength of the current candle (from -100% to +100%) for each timeframe, based on where the close is relative to the candle’s range. - Customizable Panel:
- Set font size, distance from the last candle, and vertical spacing.
- Choose your preferred timeframes (M1, M5, M15, M30, H1, H4, etc.).
- Colors automatically change: green for strong bullish, red for strong bearish, white for neutral.
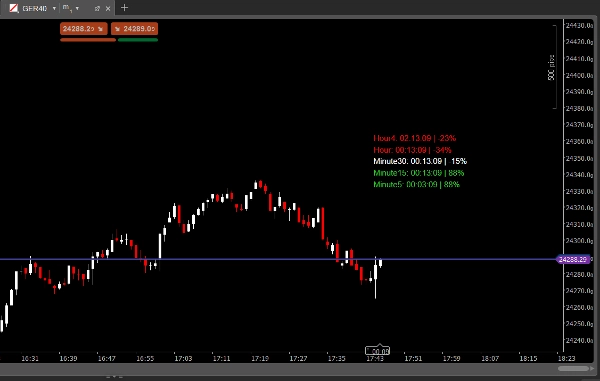
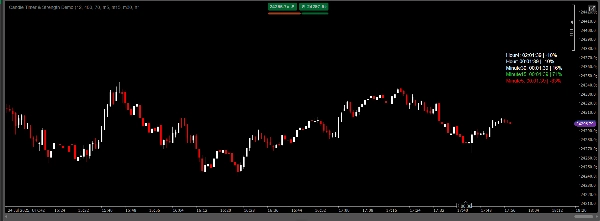
- Always Visible:
The panel is always visible on your chart, making it easy to monitor market timing and momentum at a glance. - Perfect for:
- Scalpers and daytraders who need precise candle timing.
- Multi-timeframe traders who want to see momentum and timing in one place.
- Anyone who wants to improve their entry/exit timing and candle reading skills.
How it works:
- The indicator calculates the time left until the close of the current candle for each selected timeframe.
- It also calculates the candle’s strength as a percentage:
- +100% = close at the very top of the candle (strong bullish)
- -100% = close at the very bottom (strong bearish)
- 0% = close in the middle (neutral)
- The panel updates in real time and is fully customizable.
Parameters:
- Font Size
- Distance from Candle (pips)
- Vertical Spacing (pips)
- TimeFrame 1–5 (custom)
- H4 Start Hour (for brokers with non-standard H4 candles)
Why choose Candle Timer & Strength?
- Save time: No more switching timeframes or calculating candle closes in your head.
- Trade with confidence: Instantly see if the market is gaining or losing momentum.
- Professional look: Clean, modern panel fits any chart style.
- Easy to use: Plug & play, no coding required.
Note:
This demo is for evaluation purposes only.
If you like the indicator, please purchase the full version for unlimited use.
To get the full version, search for "Candle Timer & Strength" in the cTrader Store.
See all my indicators and bots:
https://ctrader.com/pl?search=kobud.222&u=kobud.222
http://www.youtube.com/@Robi22-22
📩 Questions? Suggestions? Discount?
Contact available in my profile: Robikobud
Summary
AI summary
Candle Timer & Strength Demo for cTrader is an indicator designed to display real-time countdowns to the close of current candles across up to five customizable timeframes. It provides a clear panel showing the remaining time until candle close and the candle’s strength as a percentage, ranging from -100% (strong bearish) to +100% (strong bullish), based on the candle’s close position relative to its range. The panel is fully customizable, allowing users to adjust font size, vertical spacing, distance from the last candle, and select preferred timeframes such as M1, M5, M15, M30, H1, and H4. Colors dynamically indicate momentum: green for strong bullish, red for strong bearish, and white for neutral. The panel remains always visible on the chart, facilitating quick assessment of market timing and momentum. This tool is suited for scalpers, day traders, and multi-timeframe traders seeking precise candle timing and momentum insights to improve entry and exit decisions. Parameters include font size, spacing, timeframe selection, and H4 start hour adjustment for brokers with non-standard candle timings. This demo version is intended for evaluation purposes.
Indicator profile
Customer reviews
0.0
Reviews: 0
Customer reviews
No reviews for this product yet. Already tried it? Be the first to tell others!
Discussion
FAQ
Products available through cTrader Store, including trading bots, indicators and plugins, are provided by third-party developers and made available for informational and technical access purposes only. cTrader Store is not a broker and does not provide investment advice, personal recommendations or any guarantee of future performance.
More from this author


Price
Since 31/12/2024
7
Sales
1.14K
Free installs