Candle Timer & Strength Panel Demo -
"Candle Timer & Strength Panel Demo -" logo
09/08/2025
55
Desktop
Since 31/12/2024
Sales
3
Free installs
296

Candle Timer & Strength Panel DEMO for cTrader

DEMO VERSION – 24 hours free trial!

This is a DEMO version of the Candle Timer & Strength Panel indicator for cTrader.
You can use all features for 24 hours after installation.
After the trial period, the indicator will expire and display a message.
To get the full version, search for "Candle Timer & Strength Panel" in the cTrader Store.

Key Features:

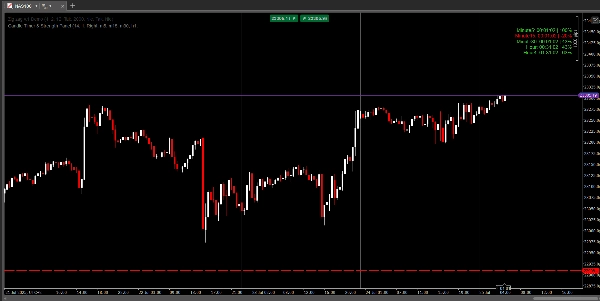
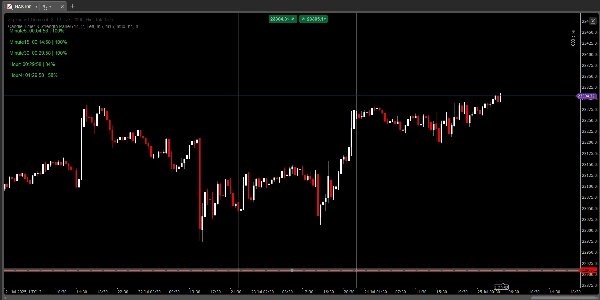
  • Fixed Panel Overlay:
    • The timer and strength for each selected timeframe are always visible in a single, easy-to-read panel at the top of your chart.
    • Choose panel position: left, center, or right.
  • Multi-Timeframe Candle Timers:
    • See the countdown to the next candle close on up to 5 selected timeframes.
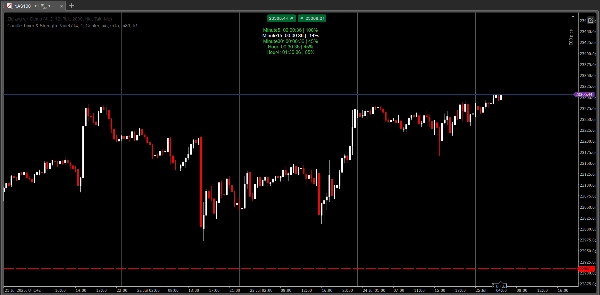
  • Candle Strength in %:
    • Instantly view the strength of the current candle (from -100% to +100%) for each timeframe, based on where the close is relative to the candle’s range.
    • Dynamic color coding: green for strong bullish, red for strong bearish, white for neutral.
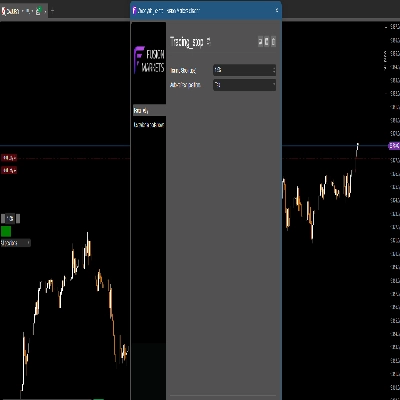
  • Customizable Display:
    • Set font size, vertical spacing, and panel position.
    • Choose your preferred timeframes (M1, M5, M15, M30, H1, H4, etc.).
    • H4 Start Hour parameter for brokers with non-standard H4 candles.
  • Perfect for:
    • Scalpers and daytraders who need precise candle timing and momentum at a glance.
    • Multi-timeframe traders who want a clean, always-visible dashboard.
    • Anyone who wants to improve their entry/exit timing and candle reading skills.


How is this different from the standard Candle Timer & Strength?

  • Panel version:
    • All timers and strengths are shown in a fixed panel at the top of the chart (not next to candles).
    • The panel does not move or disappear when you zoom or scroll – it’s always in the same place.
    • Easier to read and more professional for fast decision-making and multi-timeframe analysis.
  • Standard version:
    • Timers and strengths are displayed next to the last candle on the chart and may move or overlap with price action when you zoom or scroll.


Parameters:

  • Vertical Spacing (lines)
  • Panel Horizontal Position (left, center, right)
  • TimeFrame 1–5 (custom)
  • H4 Start Hour (for brokers with non-standard H4 candles)


Why choose Candle Timer & Strength Panel?

  • Always see the most important timing and momentum data – no matter how you zoom or scroll.
  • Perfect for multi-timeframe and fast-paced trading.
  • Clean, modern, and professional look.
  • Easy to use, fully customizable, and lightweight.

Try Candle Timer & Strength Panel and take your multi-timeframe trading to the next level!

See all my indicators and bots:
https://ctrader.com/pl?search=kobud.222&u=kobud.222

http://www.youtube.com/@Robi22-22

📩 Questions? Suggestions? Discount?
Contact available in my profile: Robikobud


0.0
Reviews: 0
Customer reviews
No reviews for this product yet. Already tried it? Be the first to tell others!
More from this author
Candle Timer & Strength Demo
Candle Timer & Strength DEMO for cTrader This is a DEMO version of the Candle Timer & Strength indicator. You can use al
ZigZagSmartAlert_demo
ZigZag Smart Alert DEMO for cTrader DEMO VERSION 24 hours free trial! This is a DEMO version of the ZigZag Smart Aler
Zig zag v.1 Demo
ZigZag Pro DEMO – Multi-Swing Indicator for cTrader DEMO VERSION – 24 hours free trial! This is a DEMO version of the Z
Trading_stop Demo
Trading_stop DEMO for cTrader Description: Trading_stop is a fast, lightweight trailing stop panel for cTrader, designed
Trading_stop Plus DEMO
📄 Trading_stop Plus DEMO 🧪 DEMO VERSION – LIMITED TO 48 HOURS This is the demo version of Trading_stop Plus. It works
R S
This indicator is a simple, single-timeframe tool for showing candle sentiment directly on your chart. If you want a mor
TraderMaxBBflterXDemo-
TraderMax BB Filter X (DEMO) for cTrader 🧪 Limited-Time Demo Version (24h) TraderMax BB Filter X (DEMO) is a precision
You may also like
Indicator
Signal
FractalArrowBuySell
Fractal Arrow Buy and Sell Indicator
IR Multi Data
show symbol and time fram, daily net profit percent, daily net profit, and spread ln your chart. consider that timezone
Indicator
Indices
RSI
Stocks
+3
Advanced RSI Indicator
Advanced RSI Indicator with multi-MA smoothing, Bollinger Bands, divergence detection, and fill zones for cTrader.
Pips V4Final
Displays pips from daily open with high/low. Clean, customizable, perfect for quick daily price context.
VegaXLR - RSI and StochRSI Alerts
VegaXLR's cTrader StochRSI identifies overbought/oversold RSI levels for precise trade entries.
Indicator
Indices
RSI
Stocks
+3
FiboTrend-Pro
😎Read the description before purchasing💩
Indicator
Indices
FVG
Commodities
+4
FAIR VALUE GAP INDICATOR
Pinpoint FVGs, track fills and see mitigation stats — trade imbalances with clarity and confidence.
Indicator
Bollinger
Repiptor BB Width
Bollinger Bands Width
Range 10 Rsi
RSI Scalping cBot: quick‑fire trades on choppy symbols.
Market Sessions
Market Sessions is very important for traders.
Alpha Sentiment Pro
Alpha Sentiment Pro - See the Market's Pulse Before It Moves
Indicator
RSI
Breakout
XAUUSD
+6
Fair Value Gap Sessions
identify and highlight temporary market inefficiencies known as "fair value gaps" 🚨 within specific trading Sessions.
Indicator
Grid
NAS100
RSI
+21
Market Cipher B
Market Cipher B
Indicator
RSI
Breakout
XAUUSD
+5
Shielded Trend
Buy/Sell signals filtering noise, color-coded trends & strength shield 🛡️. Trade only with POWER ⚡
Indicator
Grid
NAS100
NZDUSD
+13
Standard Deviation Channel
Visualize trends with Standard Deviation Channel! Display median, and add customizable upper/lower deviation channels.
DailyPivotPoints
Daily Pivot Points plots key support and resistance levels to guide precise trading decisions.
Indicator
Indices
Breakout
Stocks
+3
Ichimoku Cloud Indicator
The Ichimoku Cloud is a comprehensive technical analysis system developed by Japanese journalist Goichi Hosoda
Indicator
Indices
RSI
Prop
+4
SuperEmaColorRSI
This is a super indicator that integrates the RSI indicator with a dual moving average system.