
MACD x Volume Profile
Indicator
Version 1.0, Jul 2026
Windows, Mac
Since 21/02/2026
17.43M
Traded volume
2.85K
Pips won
1
Sales
Description
The MACD x Volume Profile is a custom cTrader (cAlgo) overlay indicator designed to provide traders with a dual-perspective view of market trends and liquidity. By combining the foundational elements of the MACD indicator with a dynamic Volume Profile, it allows users to analyze momentum alongside historical price acceptance zones directly on the main chart.
Key Features:
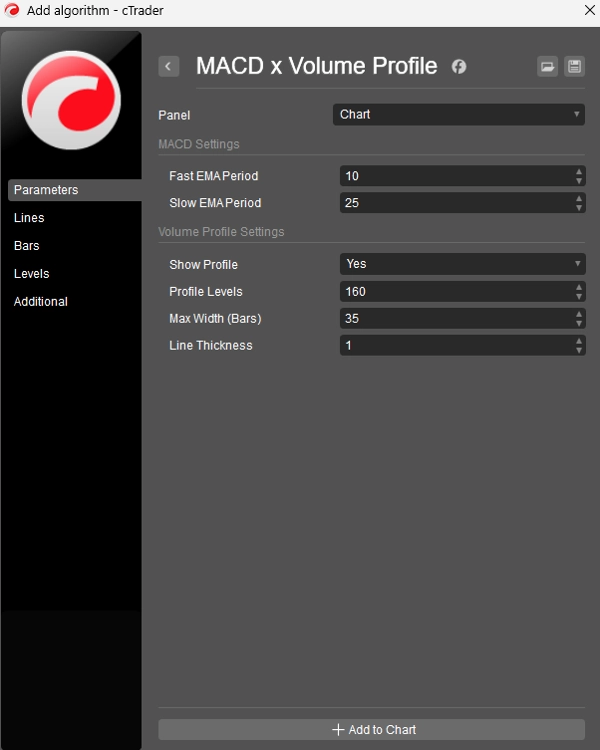
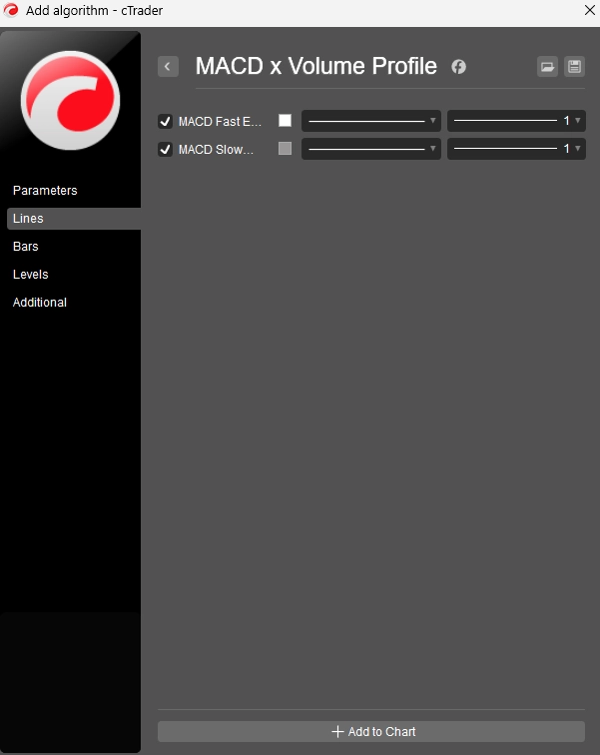
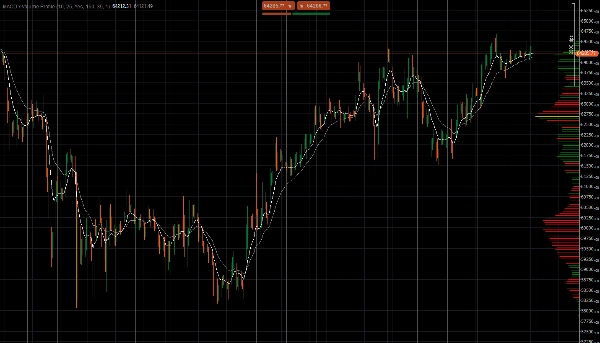
- Dual Exponential Moving Averages (EMAs): Displays a Fast EMA (default 10) and Slow EMA (default 25) directly on the price chart. The crossing and separation of these lines help identify short-term and long-term trend direction and momentum, forming the basis of standard MACD analysis.
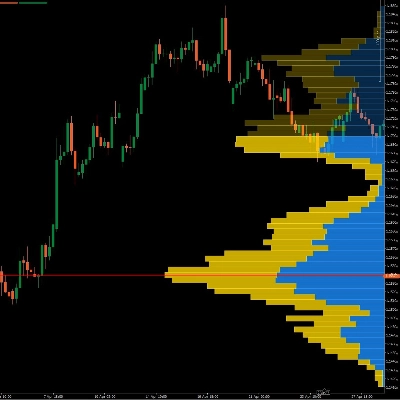
- Dynamic Visible Range Volume Profile (VRVP): The indicator dynamically calculates and draws a volume profile based only on the currently visible bars on your chart. It automatically recalculates and adjusts whenever you scroll, zoom, or resize the chart window.
- Point of Control (POC) Highlighting: The price level with the highest traded volume (the POC) is distinctly highlighted with a thicker yellow line, allowing you to instantly identify the strongest area of support or resistance within your current view.
- Directional Volume Coloring: The volume lines are color-coded to indicate buying or selling pressure. If a price bin experienced more volume during bullish candles (Close ≥ Open), it colors the profile line green. If bearish volume dominated, it colors the line red.
Parameter Customization:
- MACD Settings: Fully adjustable periods for both the Fast and Slow EMAs.
- Profile Granularity: The Profile levels parameter allows you to adjust the resolution of the volume profile (from 10 up to 200 price buckets).
- Visual Adjustments: Users can toggle the profile's visibility, scale its maximum width on the screen, and adjust the line thickness to keep the chart clean and tailored to their visual preferences.
Summary
AI summary
The MACD x Volume Profile is a cTrader (cAlgo) overlay indicator that integrates the MACD's Fast and Slow Exponential Moving Averages (EMAs) with a dynamic Volume Profile on the main price chart. It displays a Fast EMA (default 10) and Slow EMA (default 25) to help identify trend direction and momentum through their crossings and separations. The Volume Profile dynamically calculates volume distribution based on the currently visible bars, updating automatically with chart navigation. The indicator highlights the Point of Control (POC)—the price level with the highest traded volume—using a distinct yellow line to mark key support or resistance zones. Volume bars are color-coded green or red to indicate buying or selling pressure, respectively. Users can customize MACD periods, adjust the granularity of the volume profile (10 to 200 price buckets), and modify visual settings such as profile visibility, width, and line thickness to suit their preferences. This tool combines momentum analysis with liquidity visualization to support trading decisions.
Indicator profile
Indicator category
Volume
Output type
Visualisation
Data requirements
Volume
Supported signals
Trend strength
Customer reviews
0.0
Reviews: 0
Customer reviews
No reviews for this product yet. Already tried it? Be the first to tell others!
Discussion
FAQ
EMA
Volume
MACD
Moving Average
Products available through cTrader Store, including trading bots, indicators and plugins, are provided by third-party developers and made available for informational and technical access purposes only. cTrader Store is not a broker and does not provide investment advice, personal recommendations or any guarantee of future performance.
More from this author





















Price
Since 21/02/2026
17.43M
Traded volume
2.85K
Pips won
1
Sales