present
Sign up and get $50 off your first purchase
Trading product for Gann_Pivot_Vision Indicator Forex Signal, image 1
Gann_Pivot_Vision
Indicator
1 purchases
Version 1.0, Dec 2025
Windows, Mac
4.3
Reviews: 3
Trading product for Gann_Pivot_Vision Indicator Forex Signal, image 2
Trading product for Gann_Pivot_Vision Indicator Forex Signal, image 3
Trading product for Gann_Pivot_Vision Indicator Forex Signal, image 4
Trading product for Gann_Pivot_Vision Indicator Forex Signal, image 5
Since 24/10/2025
1.44M
Traded volume
6.53K
Pips won
3
Sales
418
Free installs

Description

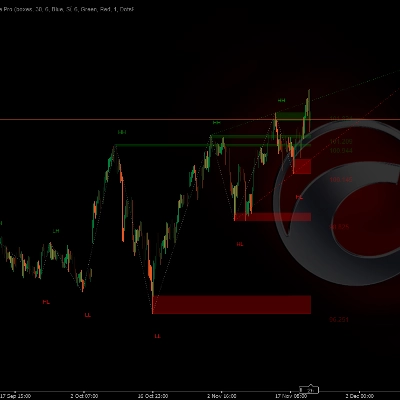
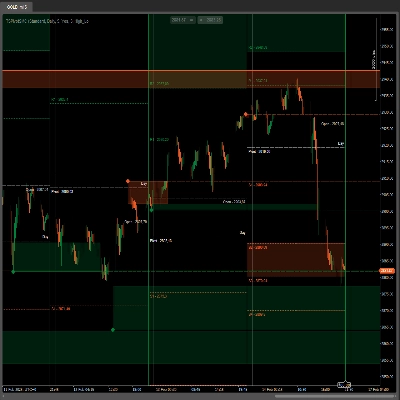
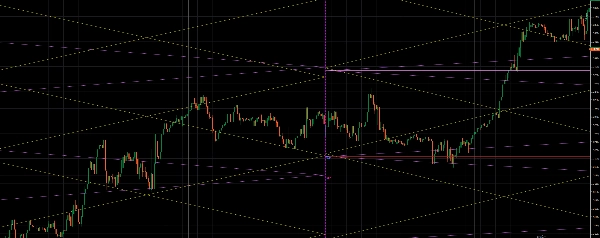
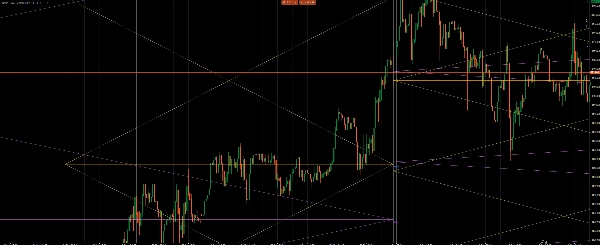
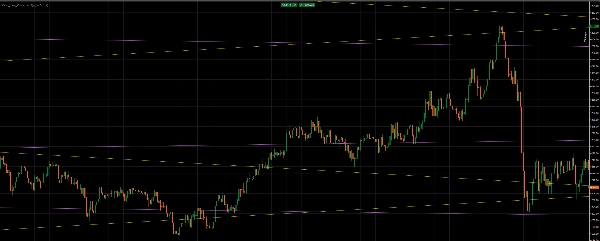
Gann Pivot Vision is an innovative analytical tool that combines classic pivot reversal levels and Gann geometry, allowing traders to visually identify key support/resistance levels and predict market reversals with high accuracy.

The indicator automatically builds:

✔ Daily Pivot Levels

✔ Weekly Pivot Levels

✔ Monthly Pivot Levels


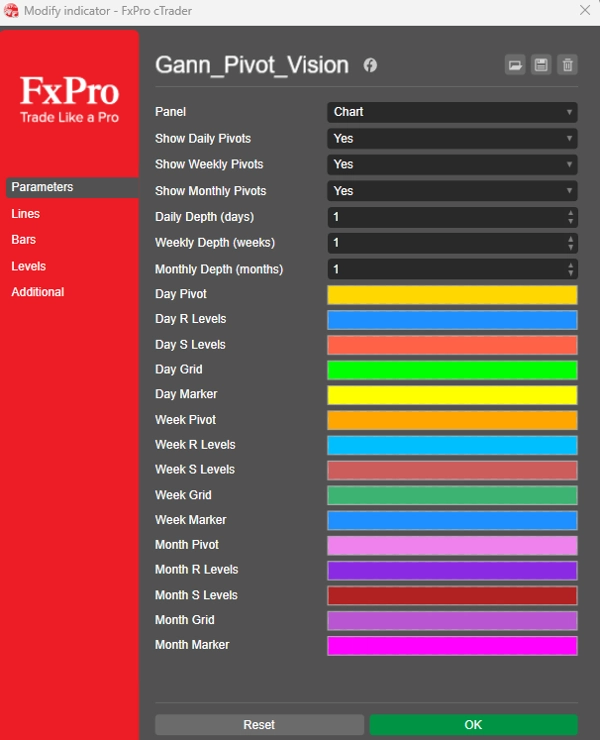
Each timeframe is displayed with its own color scheme and can be enabled or disabled if necessary.

🔷 Gann-grid and diagonal structure


Additionally, the tool generates a diamond Gann grid based on the range of the previous period.:

◾ Diagonal lines (Gann symmetry)

◾ Geometric intersections — areas of key market reactions

◾ Center of the structure = the central price of the period (Pivot Point)


This combination allows you to:

🔹 identify strong price clusters

🔹 identify areas of likely reversal

🔹 confirm trend and countertrend signals

Summary

AI summary
Gann Pivot Vision is an indicator tool that integrates classic pivot reversal levels with Gann geometry to assist traders in identifying key support and resistance levels and forecasting market reversals. It automatically calculates and displays daily, weekly, and monthly pivot levels, each distinguished by a unique color scheme that can be toggled on or off. The tool also generates a diamond-shaped Gann grid based on the previous period's price range, featuring diagonal lines that reflect Gann symmetry and geometric intersections that highlight significant market reaction zones. The center of this structure corresponds to the central price of the period, or pivot point. This combination enables users to pinpoint strong price clusters, anticipate potential reversal areas, and validate trend and countertrend signals. The indicator supports analysis across multiple markets including Forex, indices, and stocks, and is applicable to various trading strategies such as scalping, breakout, and signal-based approaches.
Indicator profile

Discussion

Customer reviews

4.3
Reviews: 3
5
33 %
4
67 %
3
0 %
2
0 %
1
0 %
Customer reviews
December 17, 2025
The opening read should not drive the only input, but the setup still needs say no.
December 12, 2025
December 10, 2025

FAQ

Forex
Signal
Breakout
Scalping
Indices
Stocks
Products available through cTrader Store, including trading bots, indicators and plugins, are provided by third-party developers and made available for informational and technical access purposes only. cTrader Store is not a broker and does not provide investment advice, personal recommendations or any guarantee of future performance.

More from this author
Indicator
Forex
Crypto
+3
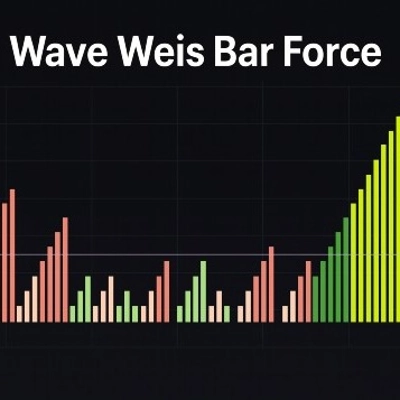
Wave Weis Bar Force - is an indicator that applies the logic of Volume waves (Weis) to determine accumulation
Indicator
AI
Forex
+10
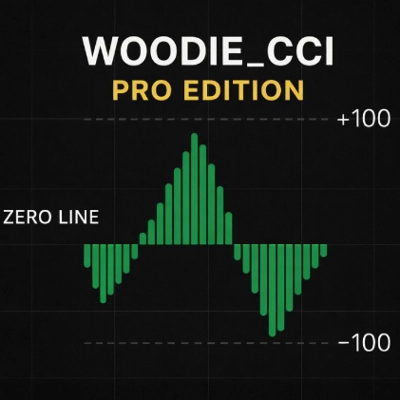
Woodie_CCI_pro is an advanced CCI-based toolkit built around the classic Woodie CCI methodology.
Indicator
Forex
Crypto
+5
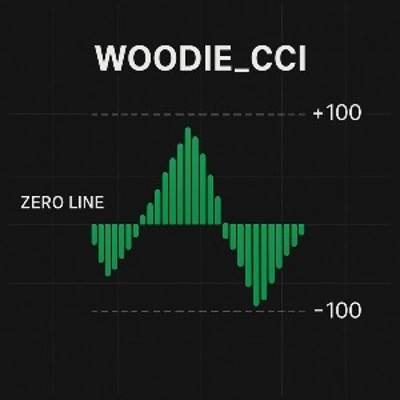
The Woodie CCI Indicator (Woodie Commodity Channel Index) is a variation of the classic CCI indicator
Indicator
ATR
Forex
+6
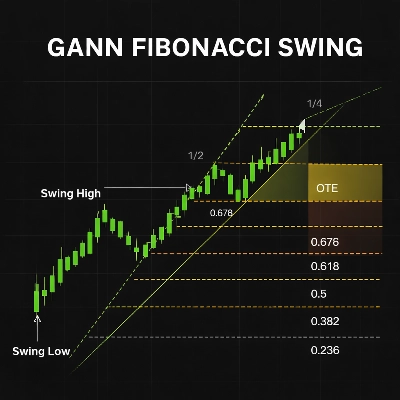
It combines swing (pivot-based) market structure detection with Gann Fan geometry and Fibonacci retracement/extension
Indicator
AI
Forex
+13
SigmaTrend Oscillator is an advanced momentum-based trend identification tool that combines dynamic price
cBot
CCI
RSI
+5
Advanced multi-strategy cBot with 30+ signal modules, risk control, sessions, filters and automated trade management.
8.1%
ROI
2
Profit factor
Indicator
ATR
SMC
+9
The Wyckoff Schematic Indicator is a professional-grade market structure tool designed to automatically detect

You may also like

Indicator
BOS
MSS
+5
WinSMC is an overlay SMC indicator for cTrader. It helps you visually identify!
Indicator
RSI
Forex
+4
New version of one of my favorites includes Fibonacci and moving average convergence divergence lines
Indicator
VWAP
Volume
+5
Multi VWAP. Three timeframes. One clean chart. Your Essential Trading Tool.
Indicator
Forex
BTCUSD
+12
🎯Automatically identifies the market's significant turning points (key H & L) and draws dynamic support and.....✍️
Indicator
Signal
USDJPY
See USD demand in one line—Composite OBV fuses six major FX pairs into a clear momentum gauge.
Indicator
Drawdown Monitor
Protect your funded account. Real-time Daily Equity Drawdown monitor with Green / Orange / Red flashing alerts.
Indicator
Forex
BTCUSD
+4
The Linear Regression Oscillator (LRO) is a technical indicator based on linear regression analysis.
Indicator
ATR
Wedge
+2
Strong Supertrend Turn Market Movement into a Clear Map Market analysis
Indicator
ATR
BOS
+5
Opening ranges, dynamic trend channels, and multi-scale breakout/retest analysis for clear intraday chart decisions.
Indicator
AI
Grid
+9
Pivot Point MultiTimeFrame with Order Block
"macdZR" logo
Top-rated
4.6
(5)
$19
Indicator
MACD
Forex
+5
MACD ZERO LAG. Get faster signals, earlier trend detection, and eliminate the delay of traditional moving averages
Indicator
Imbalance
Inside Bar
+3
A clean and powerful Smart Money Concepts tool combining Fair Value Gaps, Previous Daily High/Low, Inside/Outside bar
Indicator
📊 Smart Floating Risk Pro – Advanced Risk Management for cTrader
Indicator
RSI
BTCUSD
+5
Identify market structure effortlessly with swing highs, lows, CHoCH, and BOS levels for smart trading decisions! 📊🔍"
Indicator
Breakout
FlexSR auto‑detects pivot highs/lows to plot dynamic support & resistance lines Features customizable styling and option
Indicator
ATR
MSS
+5
Advanced market structure and institutional cycle mapper with visual reference cards and entry alerts
Indicator
VWAP
Moving Average
Vwap Bands it is highly sought after by professional traders because it includes Standard Deviation Bands
Indicator
EMA
RSI
+4
🚀📈 Plot buy/sell signals on Range Bars using Moving Averages and RSI. Clear, actionable trading insights.🚀📈

Price

Since 24/10/2025
1.44M
Traded volume
6.53K
Pips won
3
Sales
418
Free installs