
Description
The Wyckoff Schematic Indicator is a professional-grade market structure tool designed to automatically detect and visualize Wyckoff accumulation and distribution phases directly on the chart.
Built on the principles of the Wyckoff Method, this indicator identifies key institutional events such as Selling Climax (SC), Automatic Rally (AR), Spring, Sign of Strength (SOS), Buying Climax (BC), Upthrust (UTAD) and more—helping traders understand smart money behavior in real time.
Unlike traditional indicators, this tool does not rely on lagging signals but instead focuses on price structure, volume behavior, and volatility, providing a deeper insight into market dynamics.
Core Concept
The indicator is based on the idea that markets move through structured cycles:
- Accumulation → Markup → Distribution → Markdown
It automatically detects and visualizes:
- Market ranges
- Wyckoff phases (A–E)
- Key institutional events
- Structural breakouts and fakeouts
Key Features
1. Automatic Wyckoff Phase Detection
The indicator identifies all major phases of the Wyckoff cycle:
- Phase A – Stopping the trend
- Phase B – Building a cause (range formation)
- Phase C – Spring / UTAD (false breakout)
- Phase D – Trend confirmation (SOS / SOW)
- Phase E – Trend continuation
Each phase is visually highlighted with customizable colors for instant recognition.
2. Smart Event Recognition
The system detects critical Wyckoff events:
Accumulation:
- SC – Selling Climax
- AR – Automatic Rally
- ST – Secondary Test
- Spring – False breakdown
- SOS – Sign of Strength
- LPS – Last Point of Support
Distribution:
- BC – Buying Climax
- AR – Automatic Reaction
- ST – Secondary Test
- UTAD – Upthrust After Distribution
- SOW – Sign of Weakness
- LPSY – Last Point of Supply
These events are plotted directly on the chart with labels.
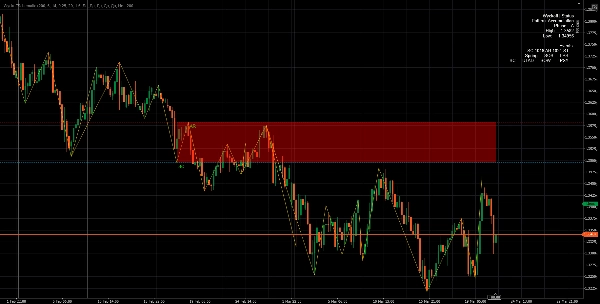
3. Adaptive Range Detection
The indicator dynamically builds and updates trading ranges:
- Automatically detects range highs and lows
- Adjusts boundaries using ATR-based tolerance
- Displays support and resistance zones
This allows traders to clearly see where the market is accumulating or distributing.
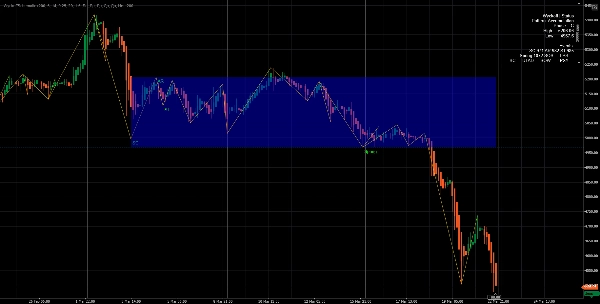
4. ZigZag Structure Engine
A built-in pivot-based ZigZag system:
- Filters market noise
- Highlights true structural highs and lows
- Ensures accurate pattern recognition
This is essential for identifying Wyckoff structures reliably.
5. Volume & Volatility Integration
The indicator uses:
- Volume Moving Average
- Volume Spike Detection
- ATR (Average True Range)
This allows it to:
- Confirm institutional activity
- Filter false signals
- Improve accuracy of events like SC, BC, Spring, UTAD
6. Real-Time State Machine Logic
At its core, the indicator runs a state machine algorithm that:
- Tracks market structure evolution
- Transitions between phases (A → E)
- Prevents duplicate signals
- Maintains context (Accumulation vs Distribution)
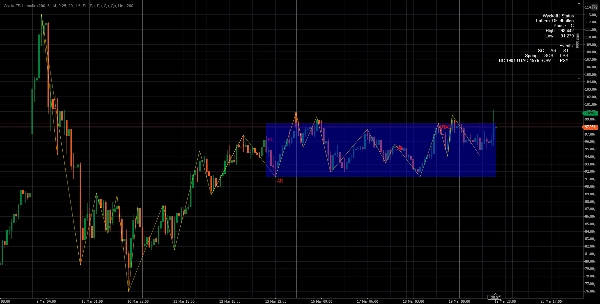
7. Visual Components
The indicator provides a full visual toolkit:
- ✔ Phase highlight boxes
- ✔ Range high/low lines
- ✔ ZigZag structure lines
- ✔ Event labels on chart
- ✔ Real-time status panel
8. Status Panel (Live Market Insight)
A built-in panel displays:
- Current pattern (Accumulation / Distribution)
- Current phase (A–E)
- Range boundaries
- Detected events
This gives traders an instant overview of market conditions.
9. Alert System
Optional popup alerts notify you when key events occur:
- SC, BC, Spring, UTAD, SOS, SOW, etc.
Perfect for monitoring multiple markets.
Advantages
✔ Smart Money Perspective
Unlike common indicators, this tool follows institutional logic, not retail indicators.
✔ Early Signal Detection
Identifies accumulation/distribution before breakouts, allowing:
- Early entries
- Better risk/reward setups
✔ Noise Reduction
Using pivots, ATR, and volume filters, the indicator avoids:
- Random signals
- Market noise
- False breakouts
✔ Fully Automated Wyckoff Analysis
No need to manually mark:
- Phases
- Events
- Ranges
Everything is detected automatically.
✔ Highly Customizable
You can adjust:
- Lookback period
- Pivot sensitivity
- ATR tolerance
- Volume sensitivity
- Visual elements (labels, boxes, lines)
✔ Performance Optimized
- Uses sliding window analysis
- Limits drawing objects
- Efficient for real-time trading
Input Parameters
Structure & Sensitivity
- Lookback Bars – analysis range
- Pivot Legs – swing detection sensitivity
Volatility & Tolerance
- ATR Period
- ATR Multiplier (Tolerance)
Volume Analysis
- Volume MA Period
- Volume Spike Multiplier
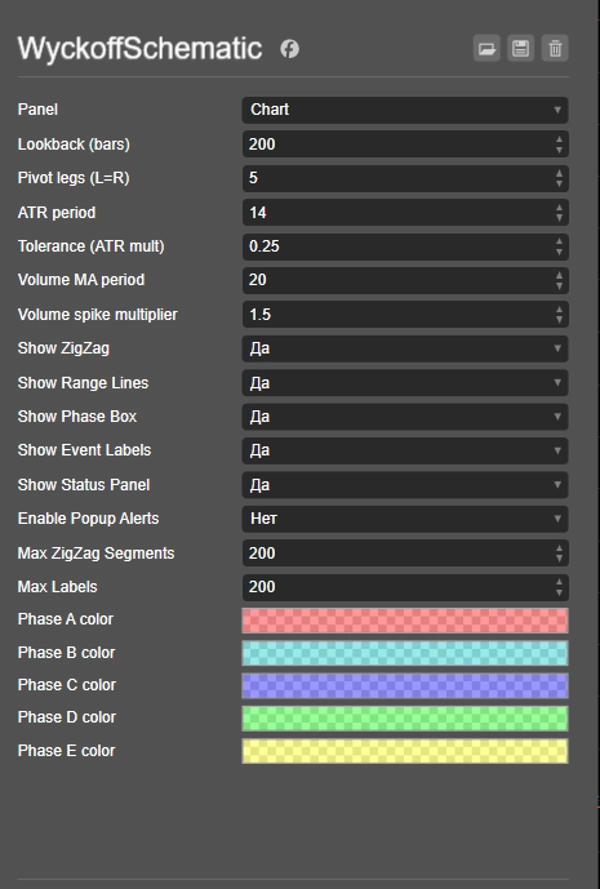
Visualization
- Show ZigZag
- Show Range Lines
- Show Phase Box
- Show Event Labels
- Show Status Panel
Alerts
- Enable popup notifications
How It Works (Simplified)
- Detects pivot highs/lows (market structure)
- Determines trend context (uptrend / downtrend)
- Looks for volume spikes + structural conditions
- Initializes Wyckoff pattern (Accumulation/Distribution)
- Tracks events and phases step-by-step
- Updates chart visuals in real time
Best Use Cases
- Smart money / Wyckoff trading
- Breakout trading
- Range trading
- Reversal detection
- Institutional order flow analysis
Conclusion
The Wyckoff Schematic Indicator is a powerful analytical tool that transforms complex Wyckoff theory into a fully automated, visual, and actionable trading system.
It allows traders to:
- Understand market intent
- Identify high-probability setups
- Trade in alignment with institutional behavior
Summary
Customer reviews
5 | 100 % | |
4 | 0 % | |
3 | 0 % | |
2 | 0 % | |
1 | 0 % |


!["Smart Money Concepts (SMC) [Iridio Capital]" logo](https://cdn.ctrader.com/image/webp/28b69fd1-ef54-4bed-9487-07e78e883be4_40934)

