


Description
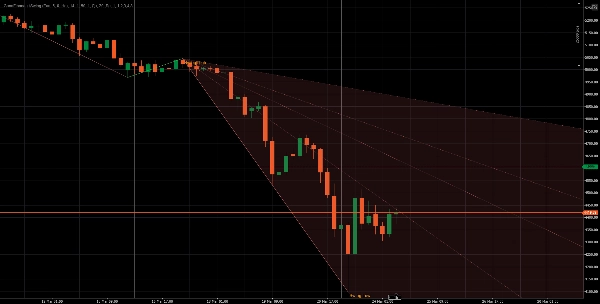
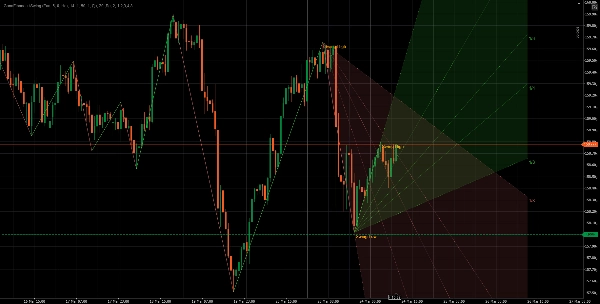
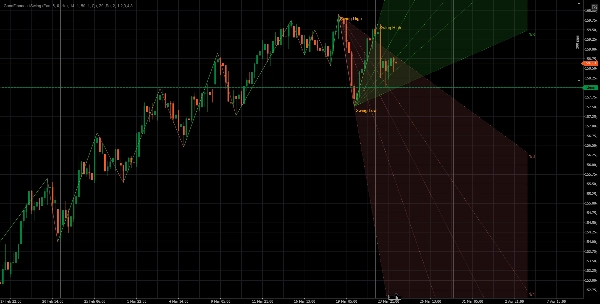
The Gann Fibonacci Swing is an advanced technical analysis indicator designed for the cTrader platform. It combines swing (pivot-based) market structure detection with Gann Fan geometry and Fibonacci retracement/extension logic, providing traders with a powerful toolkit for identifying trends, key levels, and potential reversal zones.
The indicator dynamically detects market swings (highs and lows), builds structural analysis, and then visualizes this data in two primary modes:
- Gann Fan Mode
- Fibonacci Box Mode
Core Concept
The indicator operates in three main stages:
1. Swing Detection (ZigZag Logic)
- Uses a pivot-based algorithm to detect local highs and lows
- A pivot is confirmed only after a specified number of bars (Pivot Depth)
- Filters:
- Minimum price movement (pips)
- Optional ATR-based volatility filter
This ensures that only meaningful market swings are considered.
2. Swing Construction
Each swing consists of:
- Start point (pivot)
- End point (pivot)
- Direction:
- Bullish swing: Low → High
- Bearish swing: High → Low
The indicator can track multiple recent swings based on Drawing Swing Depth.
3. Visualization Modes
Mode 1: Gann Fan
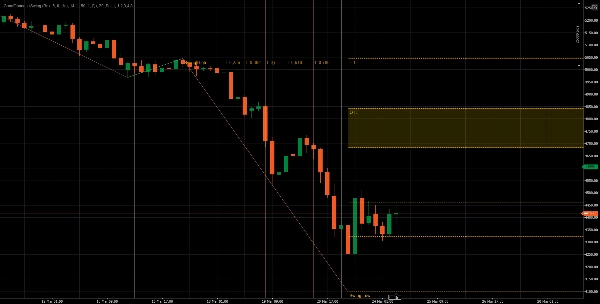
In this mode, the indicator draws Gann-style fan lines from the swing start point.
Features:
- Fan lines are calculated using:
- Base slope of the swing
- Divided by user-defined denominators (e.g., 1, 2, 3, 4, 8)
- Adjustable:
- Scale (slope multiplier)
- Projection into future bars
- Optional:
- Zone filling between fan lines
- Line labels (e.g., 1/1, 1/2, 1/3)
Interpretation:
- Fan lines act as dynamic support/resistance
- Price interaction with these lines may indicate:
- Trend continuation
- Trend weakening or reversal
Mode 2: Fibonacci Box
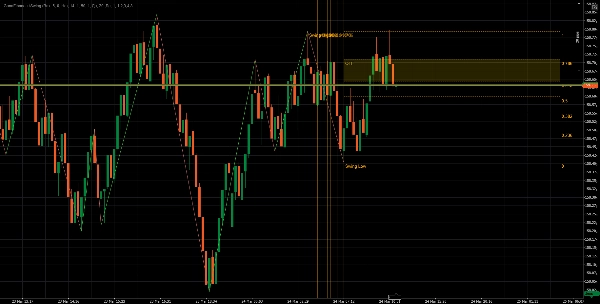
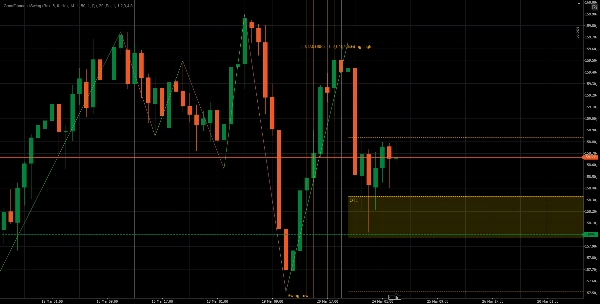
This mode builds a price-time structure based on Fibonacci ratios.
Features:
1. Horizontal Fibonacci Levels
- Drawn between swing high and low
- Common ratios:
- Can be inverted using Inverse Mode
2. Time Divisions
- Vertical lines dividing the swing duration using Fibonacci ratios
- Helps identify time-based confluence zones
3. OTE Zone (Optimal Trade Entry)
ZigZag Visualization
- Optional display of swing structure using connected lines
- Helps visually identify:
- Market structure
- Higher highs / lower lows
Labels and Annotations
- Swing points labeled:
- “Swing Low”
- “Swing High”
- Fibonacci levels and fan ratios optionally labeled
Alerts System
The indicator includes an alert mechanism:
Trigger:
- When price enters the OTE zone
Features:
- Works on bar close
- Optional:
- Sound notification
- Fires once per entry into the zone (no repeated alerts while inside)
Key Parameters
Swing Detection
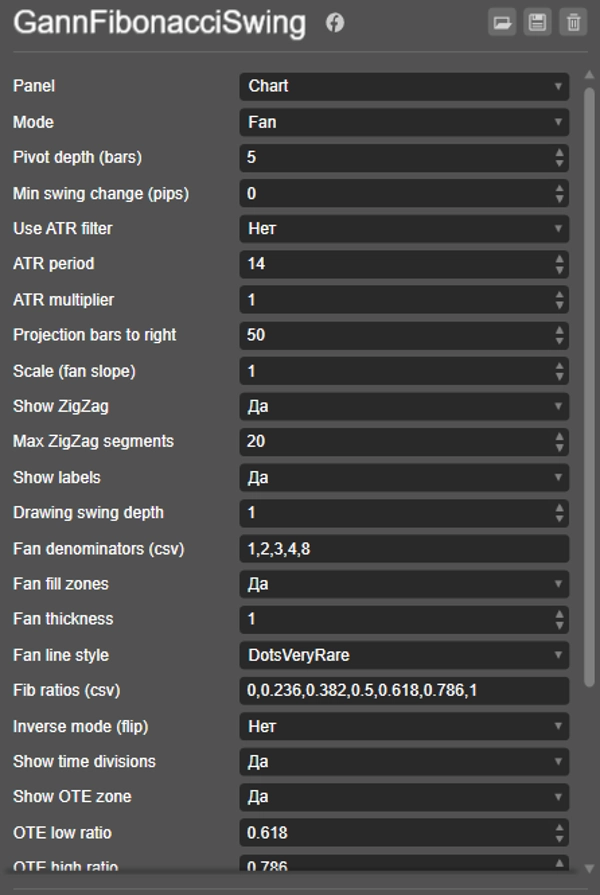
- Pivot Depth — sensitivity of pivot detection
- Min Swing Pips — minimum price movement
- ATR Filter — volatility-based filtering
Visualization
- Drawing Swing Depth — number of swings displayed
- Projection Bars — how far drawings extend into the future
Gann Fan Settings
- Fan ratios (denominators)
- Line thickness & style
- Zone filling
Fibonacci Box Settings
- Fibonacci ratios
- Inverse mode
- Time divisions
- OTE zone configuration
Alerts
- Enable/disable alerts
- OTE touch alerts
- Sound settings
How It Works in Practice
- Indicator detects pivots → builds swings
- Latest completed swings are selected
- Depending on mode:
- Fan lines OR Fibonacci structure is drawn
- Trader observes:
- Key levels
- Confluence zones
- Trend geometry
- Alerts notify when price reaches optimal zones
Use Cases
This indicator is useful for:
- Trend analysis
- Entry optimization (OTE zones)
- Dynamic support/resistance
- Swing trading strategies
- Confluence-based trading systems
Advantages
- Combines Gann + Fibonacci + market structure
- Adaptive to volatility (ATR filter)
- Works in real-time and historical data
- Highly customizable
- Clean visual output with performance optimization
Conclusion
The Gann Fibonacci Swing indicator is a hybrid analytical tool that merges price action structure with geometric and ratio-based analysis. It provides traders with a structured way to interpret market swings, identify high-probability zones, and anticipate future price behavior.
Summary
The indicator supports customizable parameters including pivot depth, minimum swing pips, ATR filter, number of swings displayed, projection bars, fan ratios, line styles, Fibonacci ratios, inverse mode, and alert settings. It features optional ZigZag visualization of market structure and labels for swing points and Fibonacci levels. Alerts can notify users when price enters the OTE zone, with sound options and single-trigger functionality.
Designed for trend analysis, entry optimization, dynamic support/resistance identification, swing trading, and confluence-based systems, the Gann Fibonacci Swing combines price action structure with geometric and ratio-based tools to help traders interpret market swings and anticipate price behavior.
Customer reviews
Discussion
FAQ
More from this author



















!["[Stellar Strategies] VBO" logo](https://cdn.ctrader.com/image/webp/f034c012-94d4-445a-a01b-febd1cdedaef_36944)
Price