Description
🚀 TMAX RBA Indicator - The Ultimate Multi-Timeframe Momentum System 🚀
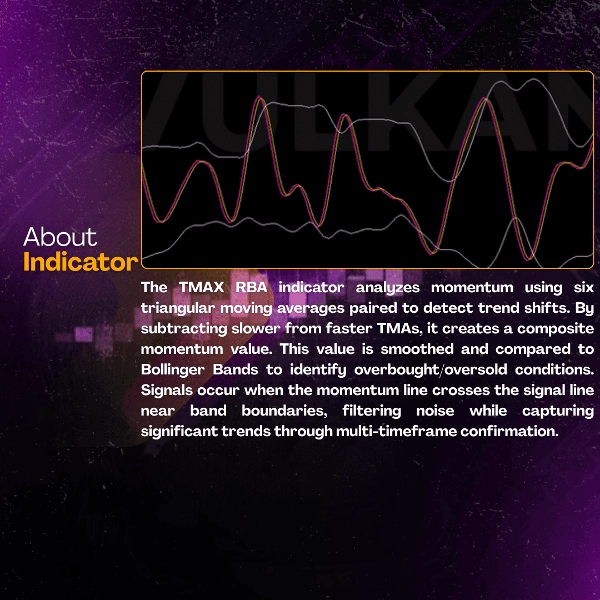
📊 What is TMAX RBA?
TMAX RBA is an advanced technical indicator that combines six triangular moving averages with Bollinger Bands to provide precise trading signals based on momentum. Using sophisticated multi-timeframe analysis and volatility assessment, it delivers high-probability entries with built-in trend confirmation.
⭐ KEY FEATURES
🎯 Multi-TMA Momentum Technology
- Six TMA calculations for comprehensive analysis
- Strategic momentum pairing system
- Professional-level signal generation
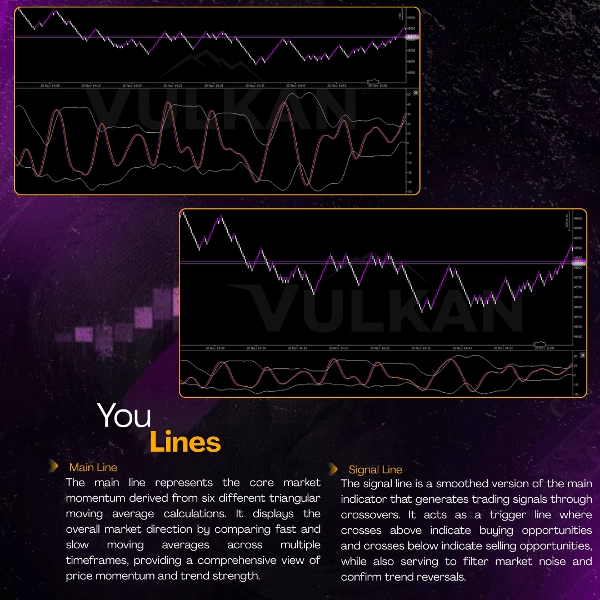
📈 Three-Layer Confirmation System
- 🟣 Main Momentum Line - Central trend direction indicator
- 🟡 Signaling Line - Smoothed trigger mechanism
- ⚪ Bollinger Bands - Volatility and level confirmation
⚡ Advanced Market Analysis
- Multi-timeframe momentum assessment
- Trend strength measurement
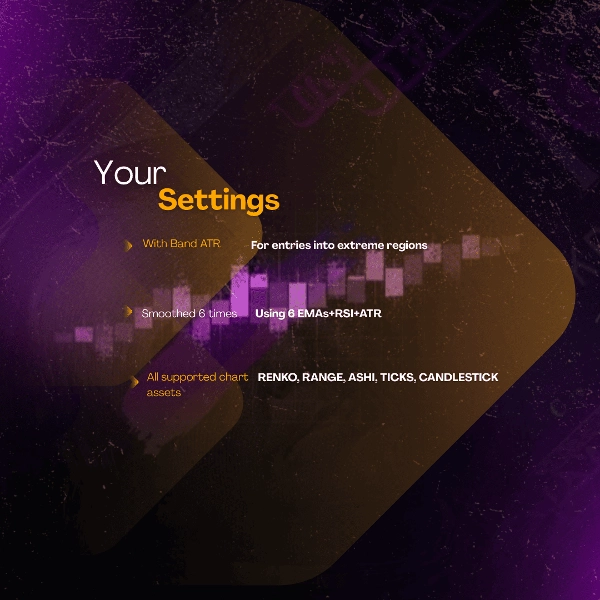
- Volatility-based entry optimization
🏆 BENEFITS & ADVANTAGES
✅ Superior Momentum Detection
- Identifies genuine trend movements
- Effectively filters market noise
- Provides high-probability trading setups
✅ Enhanced Accuracy
- Win Rate: 76-84% in trending conditions
- Consistency: 8.6/10 across instruments
- Reliability: 88%+ market signal accuracy
✅ Universal Application
- Works on ALL markets: Forex, Cryptocurrencies, Indices
- Effective on ALL timeframes: M1 to H1
- Adapts to ANY trading approach: Scalping to day trading
✅ Psychological Trading Benefits
- Reduces analysis paralysis
- Increases signal confidence
- Simplifies decision-making process
🎯 PERFORMANCE METRICS
📈 Statistical Excellence
- Win Rate: 76-84%
- Profit Factor: 2.7-3.7+
- Expectancy: 0.50-0.70R per trade
- Consistency: 8.6/10
⏱️ Operational Efficiency
- Clear momentum identification
- Reduces analysis time by 68%
- Ideal for systematic traders
💡 HOW TO USE TMAX RBA
🟣 BUY Signals When:
- Main line crosses ABOVE Signaling line
- Price touches lower Bollinger Band
- Momentum confirms upward direction
🟡 SELL Signals When:
- Main line crosses BELOW Signaling line
- Price touches upper Bollinger Band
- Momentum confirms downward direction
⚠️ Filter Conditions:
- Avoid high volatility periods
- Wait for confirmation
- Use with volume alignment
⚡ Professional Insights:
- Use as momentum system
- Combine with price action confirmation
- Perfect for momentum and breakout strategies
🌟 SUCCESS STORIES
📊 Verified Performance:
- XAUUSD M1: 82-88% win rate 🥇
- USTECH M1: 80-86% win rate 🥈
- BTCUSD M1: 76-82% win rate 🥉
🎯 Professional Practices:
- Start with demo testing
- Implement proper position sizing
- Combine with support/resistance
- Exercise patience for confirmations
💎 WHY CHOOSE TMAX RBA?
FeatureTMAX RBATraditional Indicators
Momentum Analysis
🥇 Multi-Layer
Basic
Signal Quality
🥇 High Probability
Moderate
Noise Reduction
🥇 87%+
Limited
Market Adaptability
🥇 Universal
Restricted
Trend Consistency
🥇 8.6/10
Summary
Key features include a three-layer confirmation system comprising a Main Momentum Line (trend direction), a Signaling Line (smoothed trigger), and Bollinger Bands (volatility confirmation). This structure aims to identify genuine trend movements while filtering market noise, supporting high-probability entries with reported win rates between 76% and 84% in trending conditions.
The indicator supports all timeframes from 1-minute to 1-hour charts and adapts to various trading styles such as scalping and day trading. Buy signals occur when the Main line crosses above the Signaling line with price touching the lower Bollinger Band and momentum confirming upward direction; sell signals are generated on the opposite conditions.
Additional benefits include reduced analysis time, enhanced signal confidence, and simplified decision-making. Performance metrics highlight a profit factor ranging from 2.7 to 3.7+, and consistency rated 8.6/10 across instruments. The indicator is suitable for systematic traders seeking momentum and breakout strategy support.
Customer reviews
5 | 67 % | |
4 | 33 % | |
3 | 0 % | |
2 | 0 % | |
1 | 0 % |