
Average Cost Price
Indicator
1 purchases
Version 1.0, Sep 2025
Windows, Mac
4.5
Reviews: 2
Description
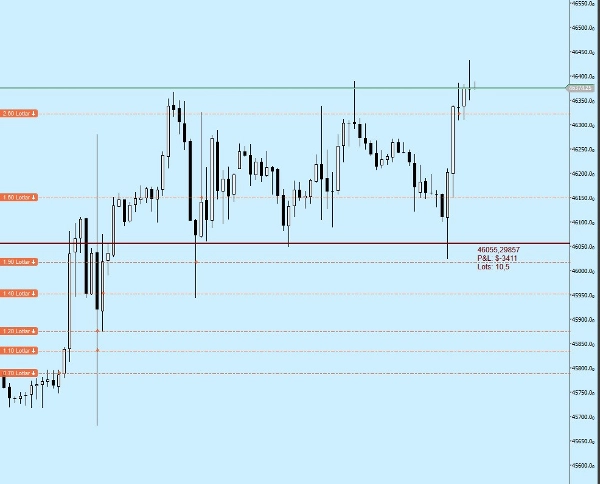
Determining the average cost price for multiple trades is difficult. Setting a Stop Loss and Take Profit is difficult because the average price of multiple trades is unknown.
The Average Cost Price indicator provides you with:
* Average Buy or Sell price line,
* Total Profit or Loss amount based on the Average Cost line,
* Total Lot Quantity
Summary
AI summary
Average Cost Price is a trading indicator designed to help traders monitor their open positions directly on the chart. It calculates and displays the average buy or sell price line for multiple trades, simplifying the process of managing positions with varying entry prices. The indicator also shows the total profit or loss amount based on this average cost line, providing a clear overview of overall position performance. Additionally, it tracks the total lot quantity held. This tool supports various markets including Forex, Stocks, Commodities, Crypto, and Indices, and is applicable to symbols such as BTCUSD, EURUSD, GBPUSD, XAUUSD, and USDJPY. By consolidating multiple trade entries into a single average cost metric, it aids in setting more accurate Stop Loss and Take Profit levels.
Indicator profile
Customer reviews
4.5
Reviews: 2
5 | 50 % | |
4 | 50 % | |
3 | 0 % | |
2 | 0 % | |
1 | 0 % |
Customer reviews
October 3, 2025
ngl, trade control feels cleaner and that is enough to keep testing it. Win rate means less without average R.
October 1, 2025
The tool feels better once the workflow feels calmer, and spread and slippage need a line in the notes.
Discussion
FAQ
BTCUSD
Prop
Forex
Indices
EURUSD
Commodities
GBPUSD
Crypto
Stocks
XAUUSD
USDJPY
Products available through cTrader Store, including trading bots, indicators and plugins, are provided by third-party developers and made available for informational and technical access purposes only. cTrader Store is not a broker and does not provide investment advice, personal recommendations or any guarantee of future performance.


Price
Since 01/09/2025
1
Sales