Brokers & props
For business
00
Days
:
00
Hours
:
00
Minutes
:
00
Seconds
Indicator
Indices
Prop
Breakout
Commodities
Forex
Crypto
RVI
04/09/2025
Desktop
Since 08/08/2025
Sales
6
Free installs
1115
"RVI" uploaded image"RVI" uploaded image

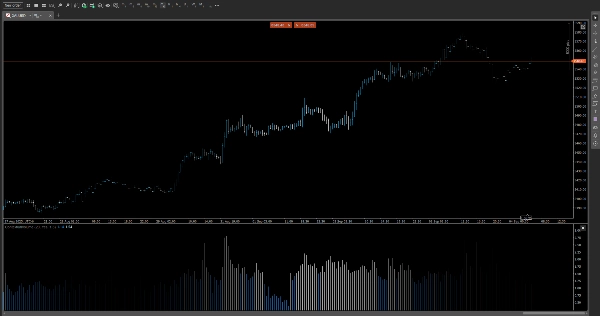
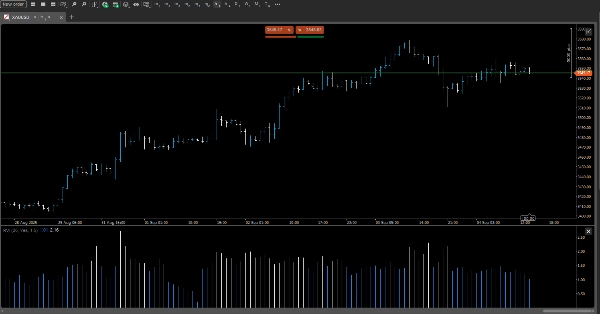
📊 Relative Volume Intraday (RVI)

Spot the volume surges that matter—when they matter.

RVI is a precision-crafted indicator that compares current volume to its historical average for the same time of day, revealing hidden momentum and liquidity shifts across intraday sessions.


🔍 Key Features

• Time-of-Day Volume Profiling

Calculates average volume per time slot (e.g., 10:15 AM) across previous sessions, giving you a contextual benchmark for every candle.

• Multi-Timeframe Support

Works seamlessly from 5-minute charts up to 12-hour timeframes, adapting to your trading style—scalping, swing, or session-based.

• Dynamic Color Coding

Highlights candles with above-average volume using customizable color thresholds. Instantly spot high activity zones with intuitive visual cues.

• Ratio vs. Difference Mode

Choose your preferred metric:

• Ratio Mode: Displays current volume ÷ average volume (e.g., 2.3×)

• Difference Mode: Shows absolute deviation (e.g., +1,200 contracts)

• Overlay or Panel Display

Toggle between inline chart overlays or a compact side panel for clean integration with your existing layout.


🎯 Use Cases

• Confirm breakout strength with volume spikes relative to typical activity

• Filter false signals during low-volume periods

• Identify institutional footprints during key intraday windows

• Enhance volume-based strategies with time-aware context


⚙️ Customization Options

• Adjustable lookback period for historical averaging

• User-defined color thresholds for volume intensity

• Toggle display mode (Ratio/Difference)

• Compatible with dark/light themes

0.0
Reviews: 0
Customer reviews
No reviews for this product yet. Already tried it? Be the first to tell others!
More from this author
FVG
The Indicator is a powerful tool for price-action traders seeking to identify and exploit short-term imbalances.
Indicator
Indices
Prop
Stocks
+3
Smooth Heiken Ashi
The Smooth Heiken Ashi indicator is a refined charting tool designed to filter out market noise and highlight true price
Indicator
Grid
NAS100
XAUUSD
+6
AutoFibRetracement
A powerful overlay tool designed to automatically plot Fibonacci retracement levels based on a custom window.
Indicator
Indices
Prop
Stocks
+3
Fractals
Fractals is a precision-engineered trading indicator for cTrader that reveals the hidden architecture of price action.
Indicator
NAS100
Indices
XAUUSD
+4
PrevDayProjection
Automatically calculates the previous day’s high and low, determines the range, and then projects Fibonacci levels.
Indicator
NAS100
Indices
XAUUSD
+7
InstitutionalSignalOscillator
A precision-engineered indicator designed for traders who demand signal integrity across volatile markets.
Indicator
NAS100
Indices
XAUUSD
+7
T3 Moving Average
A next‑generation moving average designed to deliver exceptional smoothness with minimal lag.
cBot
NAS100
Indices
Breakout
+4
VolatilityScalper
A trading robot designed for traders who want precision for high-volatility markets (XAUUSD, US500, US100, WTI, others.)
Indicator
Indices
Breakout
Prop
+6
pATR
An indicator that redefines ATR by applying a percentile-based filter giving traders a grounded view of volatility.
Indicator
NAS100
Indices
XAUUSD
+6
OR Session Zones
A high‑precision Opening Range indicator that detects session opens (NY, London, EU, Tokyo, Shanghai)
Indicator
Breakout
AI
Scalping
KaufmanEfficiencyRatio
A precision tool for measuring how efficiently price moves from point A to B.
DEnvelopSystem
DEnvelop is a high-performance trading indicator engineered for scalpers and intraday strategists who demand precision.
Indicator
Indices
Prop
Commodities
+3
OBScope
A cutting-edge indicator designed to detect and visualize high-probability zones based on swing highs, swing lows.
Indicator
Indices
Breakout
XAUUSD
+3
AnchoredVWAP
A precision overlay tool that combines session-aware VWAP logic and standard deviations.
Indicator
Indices
Prop
Breakout
+8
MarketRegimeAI
A cutting‑edge trading indicator that fuses AI and mathematics with adaptive logic to classify market regimes.
Indicator
NAS100
Indices
XAUUSD
+6
JacksonZones
Maps intraday and multiday structure using Fibonacci-projected session ranges.
Indicator
Indices
Commodities
Stocks
+2
MARainbow
MARainbow gives you the edge with four customizable moving averages—each color-coded for instant recognition.
You may also like
Indicator
Breakout
ATR
LT_SmartSwings
Detects swing highs/lows, structure, breakouts, trend lines, and fibs — great for price action trading.
Indicator
NAS100
NZDUSD
XAUUSD
+10
ALMA-Gaussian Trend Filter
📈 Adaptive ALMA-Gaussian hybrid trend filter with precision smoothing and clear buy/sell signals.
IR Candle Open
IR Candle Open plots customizable opening price lines for daily, weekly, and monthly candles
Indicator
NAS100
NZDUSD
Martingale
+26
CRT Indcator
CRTIndicator
Indicator
VWAP
RSI
XAUUSD
+9
Turtle Soup ICT Strategy
Turtle Soup ICT Strategy – Detect liquidity traps & trade smart money moves with precision on cTrader.
Indicator
Indices
RSI
StochasticRSI
Stochastic RSI (StochRSI) is a technical indicator used to measure the strength and weakness of the RSI.
Indicator
NAS100
NZDUSD
Martingale
+26
Support & Resistance Pro
The Support & Resistance Pro helps traders identify key support and resistance levels for informed trading decisions.
Indicator
Breakout
XAUUSD
Prop
+4
Gold Inicial Balance Basic
Basic & FREE. Plots New York Initial Balance (NY local time) and projects IB High, IB Low, and midline.
Momentum Trend Analyzer
Provides comprehensive trend and momentum analysis by combining EMAs, RoC, normalized ATR, RSI, and volume..
Indicator
NAS100
NZDUSD
XAUUSD
+14
Elliott Wave Fib Auto
🚀 Automated Elliott Wave & Fibonacci tool for cTrader. Spot trends, corrections & retracements fast.
E7 BBKG Indicator
E7 BBKG indicator with 80% plus accuracy used to show both, possible reversal and trend.
Indicator
Indices
Forex
Signal
+2
Golden Boom And Crash Spike Detector
Golden Boom and Crash Spike Detector is a trading tool designed for Crash 300 and Boom 300 indices on M1 Timeframe.
Indicator
Indices
Stocks
Commodities
+2
SymbolTFOverlay
The SymbolTFOverlay display the current symbol and timeframe as a semi-transparent text overlay on the chart.
Block Order Rreversal
Order BlockIndicator reversal
Indicator
Grid
NAS100
RSI
+19
Know sure thing
Know Sure Thing (KST) momentum engine
Indicator
RSI
Breakout
XAUUSD
+4
ZScore Reversion
Z-Score: Measures price deviations from its mean. Spots overbought/sold (Âą2-3 SD) & reversals. Key for stats trading
Indicator
Breakout
Stocks
Commodities
+1
Advanced Donchian Zones
MTF Donchian: Identify trend breakouts & key zones with precision. Perfect for swing & day traders seeking accuracy!
Indicator
Indices
Commodities
Stocks
+4
LT_Ind_Candles
Most used candle patterns. (1 candle, 2 candles and 3 candles patterns) and Marubozu. Bonus Fibo Risk control.