
Description
🧠 Fair Value Gap (FVG) Indicator
Reveal Hidden Market Imbalances with Precision
The Fair Value Gap (FVG) Indicator is a powerful tool for price-action traders seeking to identify and exploit short-term inefficiencies caused by aggressive institutional order flow. Built on robust 3-bar logic, it automatically detects bullish and bearish FVG zones—areas where price may return before continuing its trend.
🔍 Key Features
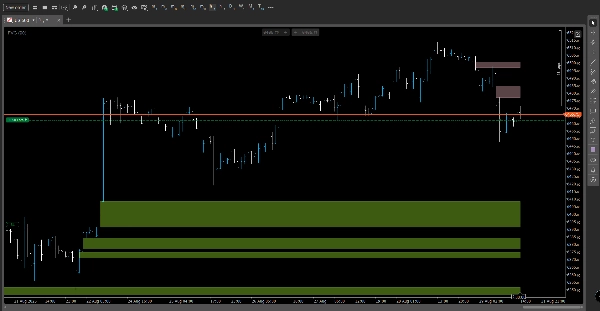
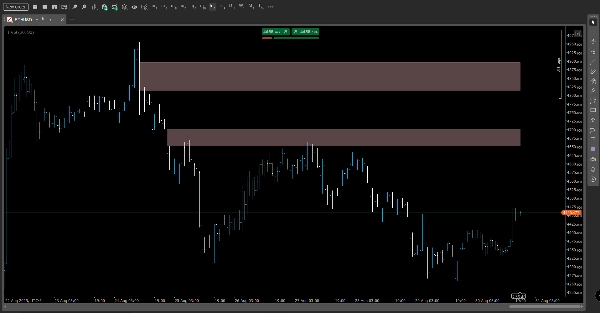
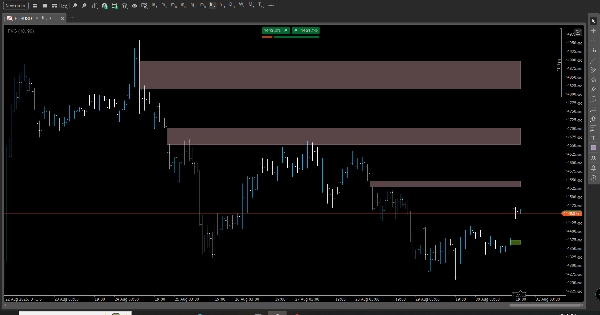
- Automated FVG Detection: Highlights imbalance zones using clean, non-repainting rectangles based on candle gaps.
- Mitigation Tracking: Monitors when price revisits and fills a gap, updating visuals and logging mitigation events.
- Unmitigated Zone Overlay: Displays active FVGs as bold horizontal lines for quick reference and trade planning.
- Adaptive Thresholding: Choose manual or auto-threshold modes to fine-tune sensitivity across volatile or quiet markets.
- Custom Visuals: Configure colors, opacity, and projection length to match your charting style.
- Terminal Logging: Compact logs report total gaps, mitigations, and active zones—perfect for strategy validation.
🎯 Benefits
- Clear Trade References: Use FVG zones as return targets, reaction areas, or confluence with other smart money concepts.
- Low Visual Footprint: Clean design keeps your charts readable while preserving essential imbalance context.
- Reliable Backtesting: Closed-bar logic ensures stable signals without repainting.
- Multi-Timeframe Ready: Ideal for scalpers, swing traders, and institutional-style analysts.
👤 Who It's For
- Smart Money & ICT Traders
- Price Action Purists
- Quantitative Analysts validating order-flow reactions
- Traders seeking high-probability entries based on market structure
Summary
AI summary
The Fair Value Gap (FVG) Indicator is designed for price-action traders to identify short-term market imbalances caused by institutional order flow. It uses a 3-bar logic to automatically detect bullish and bearish FVG zones—price gaps where the market may return before continuing its trend. Key features include automated detection with non-repainting rectangles, mitigation tracking that updates when gaps are filled, and an overlay of active unmitigated zones for easy reference. Users can adjust sensitivity via manual or automatic threshold modes and customize visual elements such as colors and opacity. The indicator logs gap statistics and mitigation events in the terminal for strategy validation. It supports multi-timeframe analysis, making it suitable for scalpers, swing traders, and institutional-style analysts. The FVG Indicator provides clear trade reference points, a low visual footprint to maintain chart readability, and reliable backtesting signals based on closed-bar logic. It is intended for traders focused on smart money concepts, price action, and order-flow validation seeking high-probability entries aligned with market structure.
Indicator profile
Customer reviews
0.0
Reviews: 0
Customer reviews
No reviews for this product yet. Already tried it? Be the first to tell others!
Discussion
FAQ
Products available through cTrader Store, including trading bots, indicators and plugins, are provided by third-party developers and made available for informational and technical access purposes only. cTrader Store is not a broker and does not provide investment advice, personal recommendations or any guarantee of future performance.


!["[Hamster-Coder] Bollinger Bands" logo](https://cdn.ctrader.com/image/webp/21d8e5d6-fb11-4bac-b9ee-cd05c2b76804_30327)


Price
26
Sales
2.13K
Free installs