
PrevDayProjection
Indicator
221 downloads
Version 1.0, Sep 2025
Windows, Mac
Description
Previous Day Projection Levels
Unlock precision trading with dynamic Fibonacci projections based on yesterday’s price action.
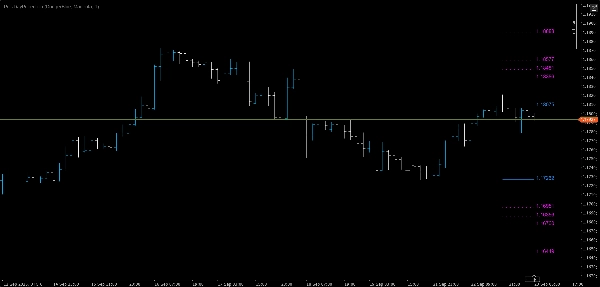
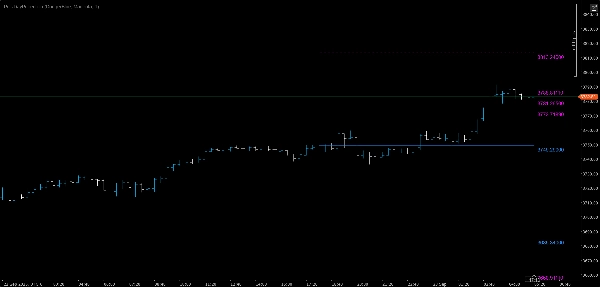
This indicator automatically calculates the previous day’s high and low, determines the range, and then projects Fibonacci levels both above and below that range — giving you instant reference points for potential support, resistance, and breakout zones.
Key Features
- 📅 Automatic Previous Day High & Low detection
- 📏 Range-based Fibonacci projections at 38.2%, 50%, 61.8%, and 100% levels
- 🔼 Above previous high: Four Fibonacci levels for bullish continuation targets
- 🔽 Below previous low: Four Fibonacci levels for bearish continuation targets
- 🎯 Segment-only lines starting from today’s first bar — no clutter across the chart
- 🏷 Price labels at the right edge for quick, at-a-glance reference
- 🎨 Customizable colors and line thickness to match your chart style
Why Traders Love It
- Clear intraday roadmap: Know exactly where key levels are before the session starts.
- Dual-direction analysis: Plan for both upside and downside moves.
- Time-saving automation: No manual drawing or recalculation needed.
- Works on any timeframe: From scalping to swing trading.
Perfect For
- Day traders looking for precise breakout targets
- Swing traders identifying key retracement zones
- Anyone who uses Fibonacci levels as part of their strategy
💡 Tip: Combine this indicator with your favorite momentum or volume tools to confirm entries and exits around these projected levels.
Summary
AI summary
PrevDayProjection is a technical indicator designed for trading platforms that automatically calculates the previous trading day’s high and low prices, determines the range, and projects Fibonacci levels based on that range. It generates key Fibonacci retracement and extension levels at 38.2%, 50%, 61.8%, and 100% both above the previous high and below the previous low. These levels serve as potential support, resistance, and breakout zones.
The indicator displays segment-only lines starting from the current day’s first bar to avoid chart clutter and includes price labels at the right edge for quick reference. Users can customize colors and line thickness to fit their chart style. It supports any timeframe, making it suitable for scalping, day trading, and swing trading.
PrevDayProjection is applicable across multiple markets including Forex, Indices, Commodities, and Crypto, with specific tags indicating symbols like EURUSD, XAUUSD (gold), and NAS100. It provides traders with a clear intraday roadmap and dual-direction analysis to plan for both bullish and bearish moves. The tool automates manual calculations, saving time and enhancing precision in identifying breakout targets and retracement zones.
Indicator profile
Customer reviews
0.0
Reviews: 0
Customer reviews
No reviews for this product yet. Already tried it? Be the first to tell others!
Discussion
FAQ
Forex
Indices
EURUSD
Commodities
Crypto
XAUUSD
NAS100
Products available through cTrader Store, including trading bots, indicators and plugins, are provided by third-party developers and made available for informational and technical access purposes only. cTrader Store is not a broker and does not provide investment advice, personal recommendations or any guarantee of future performance.


Price
26
Sales
2.16K
Free installs