
CCI - With Arrows and 40 80 EMA Logic_noSourceCode
Indicator
2 purchases
Version 1.0, Feb 2025
Windows, Mac
5.0
Reviews: 1
Description
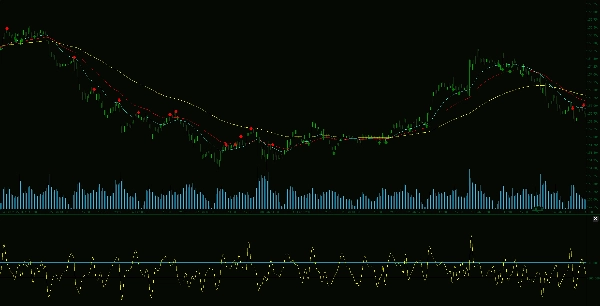
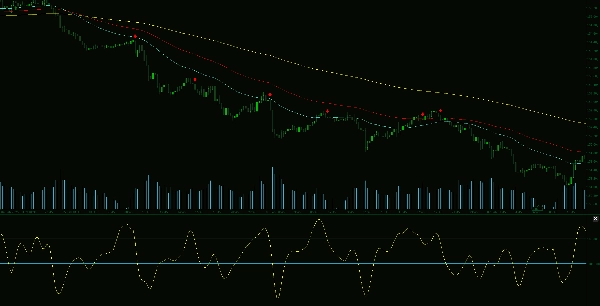
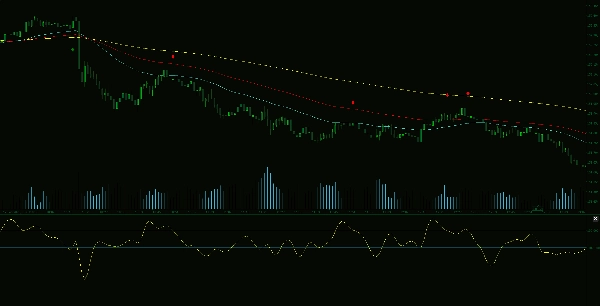
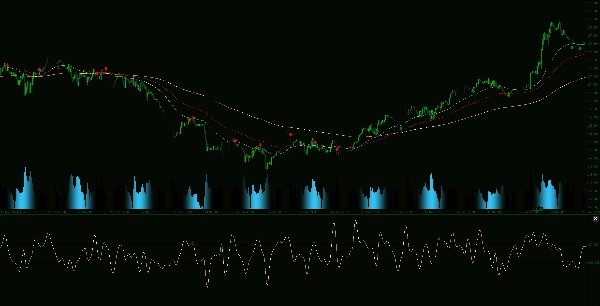
The Advanced CCI & EMA Indicator is a powerful trading tool that enhances trend analysis by combining the Commodity Channel Index (CCI) with 40 and 80 EMA logic. This sophisticated approach generates arrows that indicate potential price movement, helping traders identify high-probability trade opportunities.
Key Features:
Summary
AI summary
The Advanced CCI & EMA Indicator integrates the Commodity Channel Index (CCI) with 40 and 80-period Exponential Moving Averages (EMAs) to enhance trend analysis and momentum detection. It generates clear buy and sell arrows on the chart, signaling potential price movements based on combined momentum and trend confirmation. Key features include CCI-based identification of overbought and oversold conditions, EMA logic to confirm trend direction and filter weak signals, and customizable settings to adapt to various trading strategies and timeframes. This indicator supports traders in aligning with prevailing market trends and improving timing by reducing false reversal signals. It is suitable for use on indices and commodities markets.
Indicator profile
Customer reviews
5.0
Reviews: 1
5 | 100 % | |
4 | 0 % | |
3 | 0 % | |
2 | 0 % | |
1 | 0 % |
Customer reviews
February 25, 2025
half size is enough at the start. Low quality setups lose some appeal.
Discussion
FAQ
Indices
Commodities
Products available through cTrader Store, including trading bots, indicators and plugins, are provided by third-party developers and made available for informational and technical access purposes only. cTrader Store is not a broker and does not provide investment advice, personal recommendations or any guarantee of future performance.


Price
Since 14/01/2025
55
Sales
11.49K
Free installs