

Dem
Indicator
2 purchases
Version 2.0, Apr 2026
Windows, Mac
4.2
Reviews: 4


Since 14/03/2025
24
Sales
Description
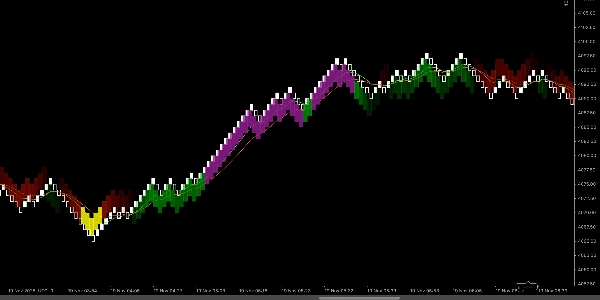
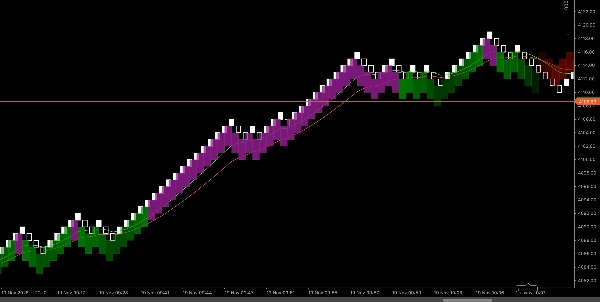
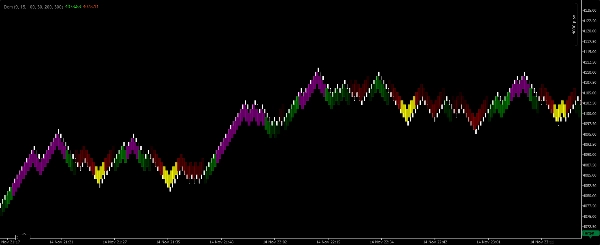
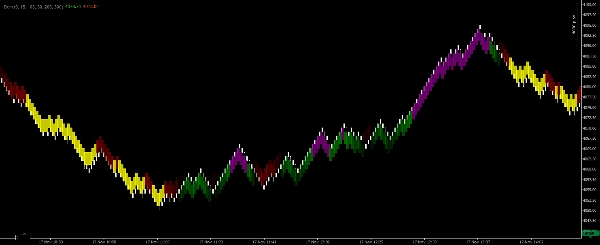
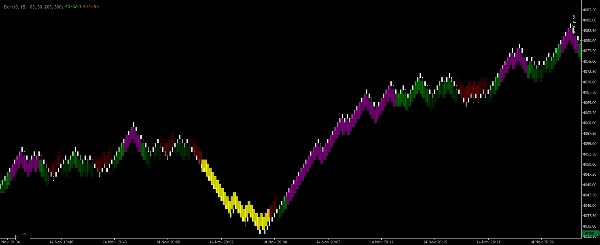
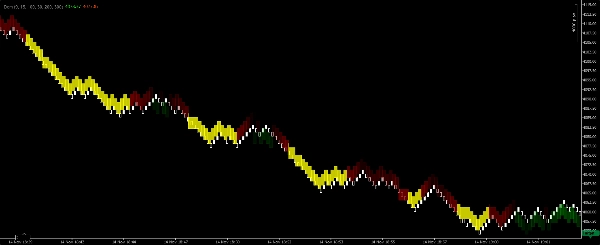
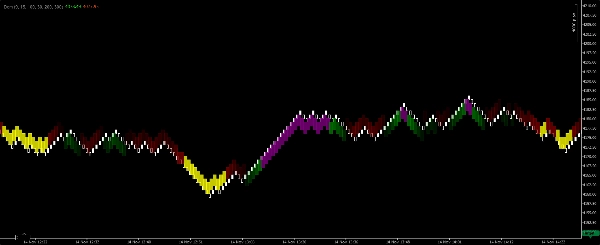
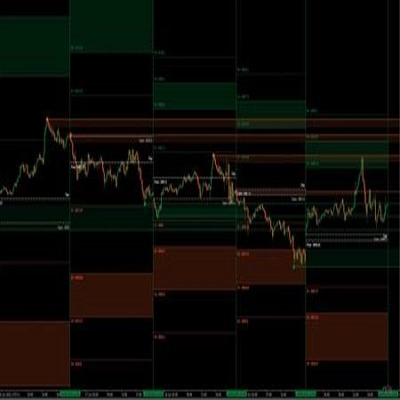
Renko EMA-Scalper Zones is a lightweight, visual scalper indicator built exclusively for Renko 100-pip charts on the cTrader platform. It uses two Exponential Moving Averages (EMAs) to identify short-term trend direction and to highlight clean, tradeable zones. The indicator draws filled rectangles on the chart in four colors so scalpers can immediately read market bias and spot higher-probability entries without manual number-crunching.
What each color means
- Green rectangle — Bullish trend confirmed. Fast EMA is above Slow EMA and the EMAs are oriented upward. Use for short, trend-following longs.
- Purple rectangle — Buy-entry zone inside a bullish context. Indicates a short-term pullback or consolidation within an active bullish trend that may offer a scalping entry.
- Red rectangle — Bearish trend confirmed. Fast EMA is below Slow EMA and the EMAs are oriented downward. Use for short, trend-following shorts.
- Yellow rectangle — Sell-entry zone inside a bearish context. Indicates a short-term pullback or consolidation within an active bearish trend that may offer a scalping entry.
How it works (logic summary)
- The indicator computes two EMAs (Fast and Slow) on a Renko 100-pip chart and assesses their relative alignment and slope to determine trend direction.
- When EMAs indicate a clear bullish alignment and momentum, the indicator plots a Green rectangle that spans the trend region. If a short consolidation or pullback appears within that bullish region, the indicator plots a Purple rectangle to mark a buy-entry opportunity.
- The same logic applies in reverse for bearish conditions, producing Red (trend) and Yellow (entry) rectangles.
- Rectangles are drawn as zones (not single bars) so scalpers can visually assess where to time quick entries and exits.
Recommended settings (scalper defaults)
- Chart type: Renko
- Renko brick size: 100 pips (indicator designed for this brick size).
- Sensitivity / detection — an adjustable parameter controls how strictly the indicator requires EMA alignment before plotting trend rectangles (lower = more signals; higher = fewer, stronger signals).
- Rectangle opacity — adjust for visual clarity over price bars.
- Session filter — recommended to restrict to high-liquidity hours for scalping.
- Max zone width (bars) — optional limit to avoid overstretched zones.
Usage guidance & scalper rules
- Treat Green/Red rectangles as trend confirmation. Prefer trading in the direction of the coloured trend zone and avoid aggressive counter-trend scalps when a trend rectangle dominates.
- Use Purple/Yellow rectangles as scalping entry windows within the confirmed trend — look for a quick micro-structure trigger (e.g., momentum bar, breakout of a small consolidation) before entering.
- Targets should be tight and realistic for scalping (small multiples of your stop). Use fixed pip targets or min-bar confirmations depending on your risk profile.
- Place stops beyond the recent micro-structure low/high or outside the entry zone; scalping requires disciplined, small losses.
- Combine with volume/price-action confirmation (if available) and trade only during active sessions.
- Backtest visually on your instruments — Renko 100-pip favors volatile pairs and instruments where 100-pip bricks produce useful price structure for scalping.
Summary
AI summary
Renko EMA-Scalper Zones is a scalping indicator designed for use on Renko charts with 100-pip brick size within the cTrader platform. It employs two Exponential Moving Averages (EMAs)—a fast and a slow EMA—to determine short-term trend direction and identify tradeable zones. The indicator visually represents market conditions by drawing colored rectangles on the chart: green for confirmed bullish trends, purple for buy-entry zones during bullish pullbacks, red for confirmed bearish trends, and yellow for sell-entry zones during bearish pullbacks. These rectangles span zones rather than single bars, allowing traders to quickly assess trend bias and potential entry points. Users can adjust sensitivity to control signal frequency, rectangle opacity for clarity, and apply session filters to focus on high-liquidity trading hours. The indicator is intended to support scalping strategies by highlighting trend confirmations and entry windows, recommending tight targets and disciplined stop placements based on recent price structure. It is suitable for volatile instruments such as Forex pairs (e.g., BTCUSD), commodities (e.g., XAUUSD), and cryptocurrencies. The tool facilitates visual, momentum-based scalping decisions without manual calculation, emphasizing trend-following entries within clearly defined zones.
Indicator profile
Customer reviews
4.2
Reviews: 4
5 | 50 % | |
4 | 25 % | |
3 | 25 % | |
2 | 0 % | |
1 | 0 % |
Customer reviews
November 25, 2025
A decent setup here should survive 50 quick trades without looking messy. A few sessions of data make the result easier to trust. The useful comparison is hit rate versus average R.
November 18, 2025
The product feels more useful when the plan is already written down. A 13 setup run on daily close keeps the review grounded.
November 18, 2025
This feels useful when you already has a plan. The main value is short term execution, not chasing every signal that appears. Early sizing should stay modest until the journal looks stable.
November 18, 2025
Useful tool, but not for lazy entries. It supports short term execution and feels more useful if the trader stays selective.
Discussion
FAQ
BTCUSD
Forex
Signal
Scalping
Commodities
Crypto
XAUUSD
Products available through cTrader Store, including trading bots, indicators and plugins, are provided by third-party developers and made available for informational and technical access purposes only. cTrader Store is not a broker and does not provide investment advice, personal recommendations or any guarantee of future performance.
More from this author
























Price
Since 14/03/2025
24
Sales