
Description
VolumeProfileSuite is an advanced and flexible Volume Profile indicator for cTrader.
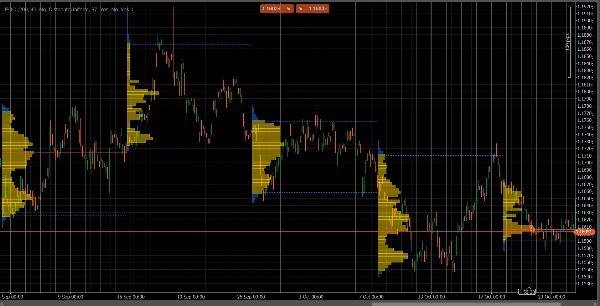
Its primary purpose is to analyze volume distribution (i.e., where trading activity occurred) at different price levels to identify areas of "value" (high volume) and "rejection" (low volume). This helps you find the most significant support and resistance levels based on real market activity.
Its unique feature is that it combines two powerful analysis modes into a single tool, selectable via the Profile Mode parameter:
FixedRangeMode: Perfect for macro analysis. It allows you to analyze a single, large block of your choice (like the last 1000 bars or a specific date range, e.g., "all of last week"). It is ideal for finding major, long-term support/resistance levels.PeriodicMode: Perfect for micro and behavioral analysis. It automatically draws a new profile every "N" bars (e.g., every 100 bars). This allows you to see how the POC and Value Area evolve over time and to study the market's repetitive patterns.- Parameter Guide (English)
Here is the updated guide for your new unified VolumeProfileSuite indicator. This guide is crucial as it explains which parameters to use (and which to ignore) based on your selected mode.
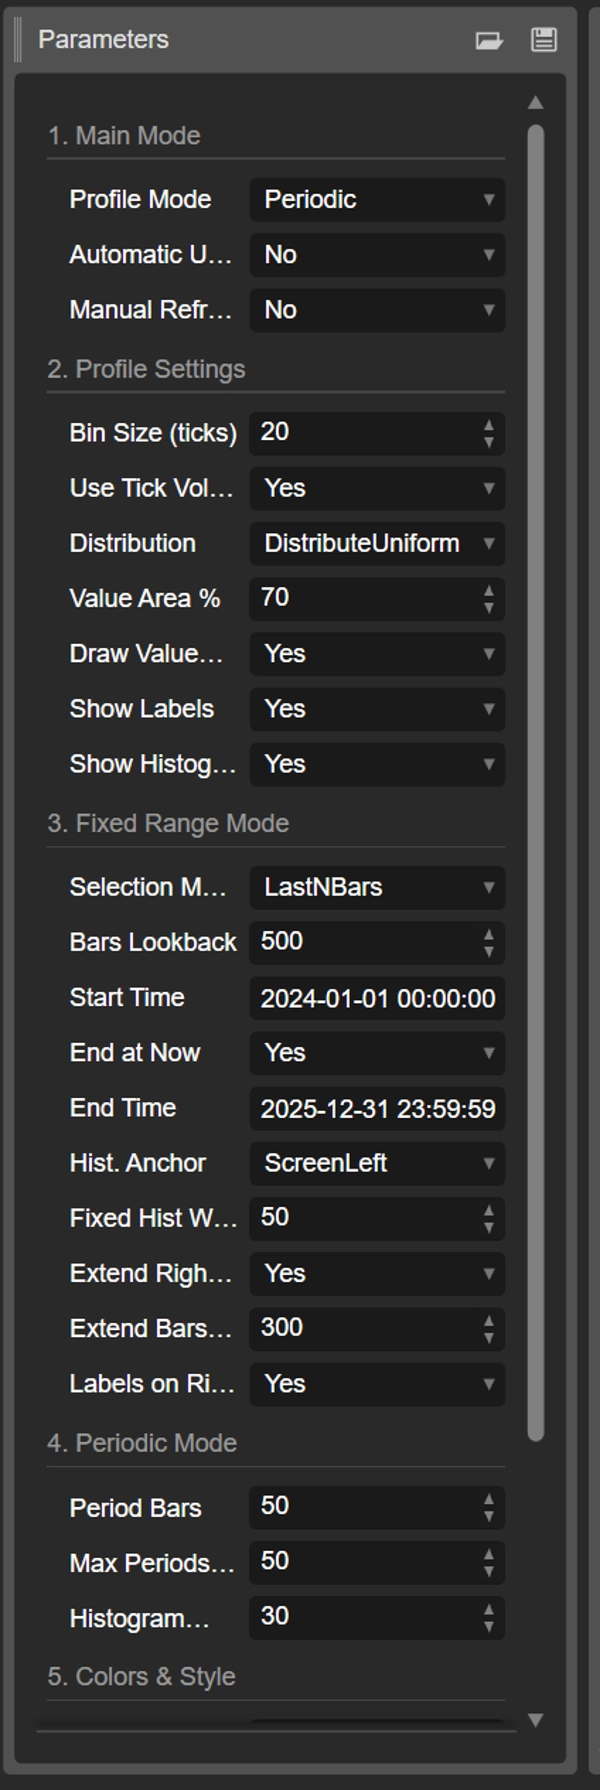
Group 1: Main Mode
- Profile Mode: This is the most important parameter and acts as the master switch.
FixedRange: Activates the "single block" mode. The indicator will analyze only one interval specified by you (using the settings in Group 3).Periodic: Activates the "cyclical" mode. The indicator will automatically analyze the entire chart in blocks (based on the settings in Group 4).
IMPORTANT: When in
FixedRangemode, you must ignore all parameters in "Group 4: Periodic Mode". When inPeriodicmode, you must ignore all parameters in "Group 3: Fixed Range Mode".
Group 2: Profile Settings
These parameters are common and apply to both modes (FixedRange and Periodic).
- Bin Size (ticks): Controls the vertical "resolution" of the profile. A low value (e.g.,
1) creates many thin price rows (very detailed). A high value (e.g.,10) groups prices into thicker rows (less detailed, "smoother"). - Use Tick Volume: If
true(recommended), the profile uses real tick volume, which is very accurate. Iffalse, it simply counts "1" for each bar. - Distribution: Defines how a bar's volume is distributed.
DistributeUniform(default): "Smears" the bar's volume across all price levels it touched, from its low to its high.CloseOnly: Assigns all of the bar's volume only to its closing price.
- Value Area %: Sets the percentage of volume that constitutes the "Value Area" (the area of highest trade activity). A value of
70(70%) is the market standard. - Draw Value Area (VAH/VAL): If
true, draws the horizontal lines for the Value Area High (VAH) and Value Area Low (VAL). - Show Labels: If
true, shows text labels ("POC", "VAH", "VAL"). (Be careful: inPeriodicmode, this can clutter the chart). - Show Histogram: If
true, draws the volume histogram (the horizontal bars).
Group 3: Fixed Range Mode
⚠️ Use these parameters ONLY if "Profile Mode" is set to FixedRange.
- Selection Mode: Chooses how to define your single block.
DateRange: Uses a specific start and end date/time.LastNBars: Uses the last N bars.
- Bars Lookback: (For
LastNBarsonly) How many bars back to analyze (e.g.,500). - Start Time / End at Now / End Time: (For
DateRangeonly) Define the start and end of your interval. - Hist. Anchor: (For
FixedRangeonly) Defines where to anchor the histogram. DateRangeStart: At the start of your interval (can be off-screen).ScreenLeft: To the left edge of the visible window.ScreenRight: To the right edge of the visible window (in the empty space).
- Fixed Hist Width (bars): The width of the histogram (in bars) for the
FixedRangemode. - Extend Right Only: If
true, the POC/VAH/VAL lines are extended into the future. - Extend Bars: (Only if
Extend Right Onlyistrue) How many bars to extend the lines by. - Labels on Right: If
true, places price labels at the right end of the extended lines.
Group 4: Periodic Mode
⚠️ Use these parameters ONLY if "Profile Mode" is set to Periodic.
- Period Bars: This is the key parameter for this mode. It defines how many bars to include in each cyclical block (e.g.,
100). - Max Periods to Draw: 🌟 SAFETY PARAMETER! This limits the number of cyclical profiles drawn to prevent cTrader from crashing.
50means it will only draw the most recent 50 profiles, even if the history has more. Do not set this too high (e.g., > 200) or cTrader may freeze! - Histogram Width (bars): The width of the histogram (in bars) for each cyclical block.
Group 5: Colors & Style
These parameters are common and apply to both modes.
- POC Color: The color of the Point of Control line.
- VA Color: The color of the VAH and VAL lines.
- Line Thickness: The thickness of the POC, VAH, and VAL lines.
- VA Histogram Color: The color of histogram bars inside the Value Area (default: Yellow).
- Outside Hist Color: The color of histogram bars outside the Value Area (default: Blue).
- Histogram Opacity %: The transparency (opacity) of the entire histogram.
Summary
The indicator offers two main analysis modes selectable via the Profile Mode parameter:
1. FixedRange Mode: Analyzes a single user-defined interval, such as a specific date range or the last N bars, suitable for macro-level, long-term support and resistance identification.
2. Periodic Mode: Automatically segments the chart into consecutive blocks of N bars, drawing a new profile for each. This mode supports micro-level and behavioral analysis by tracking how the Point of Control (POC) and Value Area evolve over time.
Common configurable settings include bin size (price resolution), volume type (tick volume or bar count), volume distribution method, value area percentage, and visual options such as histogram display and labeling. FixedRange and Periodic modes have distinct parameter groups to tailor their respective analyses.
Color and style options allow customization of POC, Value Area lines, and histogram appearance. The tool supports various markets including Forex, indices, commodities, stocks, and cryptocurrencies, as indicated by its relevant tags.
Customer reviews
5 | 50 % | |
4 | 50 % | |
3 | 0 % | |
2 | 0 % | |
1 | 0 % |


