
ZigzagSR
Indicator
5 purchases
Version 1.0, Jun 2025
Windows, Mac
4.3
Reviews: 3
Description
ZigzagSR – Dynamic Zigzag Swings with Automated Support & Resistance
Unlock clearer market structure and precise entry zones with ZigzagSR, a powerful cTrader indicator that:
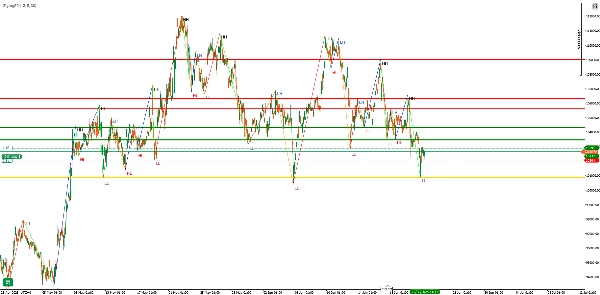
- Plots non–repainting zigzag swings (higher highs, lower highs, higher lows, lower lows) in real time
- Automatically draws dynamic support & resistance levels based on the most recent pivot swings
- Labels each swing point (“HH”, “LH”, “HL”, “LL”) for at-a-glance trend clarity
Key Features
- Adaptive Zigzag Detection
- Configurable Depth, Deviation, and Backstep parameters to fine-tune sensitivity to market noise
- Non-repainting logic ensures that historical signals remain stable once drawn
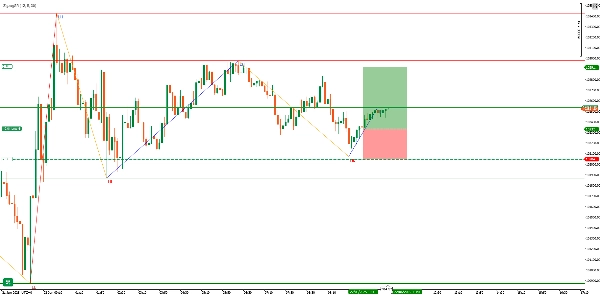
- Automatic SR Levels
- Draws a Pivot line at the last valid swing point (gold line)
- Highlights up to the last three Resistance highs (red lines) and three Support lows (green lines) before the pivot
- Lines update seamlessly as new swings form, keeping your chart tidy
- Clear Visual Labels
- “HH” (Higher High) and “LH” (Lower High) for bearish/higher peaks
- “HL” (Higher Low) and “LL” (Lower Low) for bullish/lower troughs
- Color–coded zigzag segments:
- HH → Lime
- LH → Orange
- HL → Blue
- LL → Red
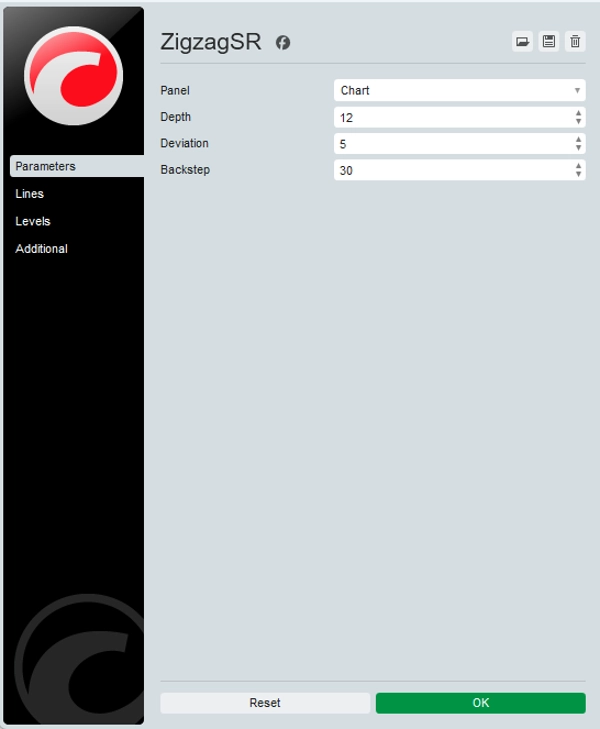
Inputs & Customization
ParameterDefaultDescription
Depth
12
Look-back bars to identify local highs/lows
Deviation
5
Minimum price move (in ticks) to count as a swing
Backstep
3
Bars to “rewind” for suppressing false pivots
Tip: Increase Depth & Deviation on higher timeframes to filter noise; lower them on M1/M5 for sensitivity.
Why Use ZigzagSR?
- Trend Confirmation: Clearly distinguish impulsive swings vs. corrective moves—ideal for swing and breakout traders.
- SR Entry Zones: Automatically marked levels help you pinpoint entry, stop-loss, and take-profit zones without drawing lines manually.
- Strategy Development: Labels and lines feed directly into EAs/cBots or manual systems—build consistent, rules-based setups.
How It Works
- High/Low Mapping
- Scans bars over the last
Depthperiods to flag local extremes (_highMap&_lowMap).
- Scans bars over the last
- Swing Construction
- Alternates between bullish and bearish states, adding only significant pivots to the swing list.
- Label Assignment
- Compares each pivot with the previous to tag it as HH/LH or HL/LL.
- SR Drawing
- Identifies the latest pivot as the “pivot line,” then plots the preceding three valid highs and lows as resistance/support.
- Zigzag Rendering
- Connects all swing points with colored trendlines and overlays text labels slightly offset for clarity.
Use Cases & Tips
- Swing Trading: Ride multi-bar impulses—enter on pullbacks to the pivot line, target the next SR level.
- Breakout Confirmation: Wait for price to pierce a resistance line drawn by ZigzagSR, then confirm with volume or RSI.
- Overlay with Other Indicators: Combine with moving averages, RSI divergences, or volume profiles to strengthen signals.
Get started in seconds:
- Install ZigzagSR from the cTrader Store.
- Drop it onto any chart—no external libraries required.
- Tweak the three input parameters to your preferred timeframe and strategy style.
Elevate your chart analysis with real-time swing structure and dynamic support & resistance—try ZigzagSR today!
Summary
AI summary
ZigzagSR is a cTrader indicator that dynamically identifies market swings and automatically plots support and resistance (SR) levels. It detects non-repainting zigzag swings in real time, labeling each pivot as Higher High (HH), Lower High (LH), Higher Low (HL), or Lower Low (LL) to clarify trend direction. The indicator draws a pivot line at the latest valid swing point and highlights up to three preceding resistance highs and support lows, updating these levels seamlessly as new swings form.
Key customizable parameters include Depth (look-back bars for local highs/lows), Deviation (minimum price move in ticks to qualify as a swing), and Backstep (bars to rewind to suppress false pivots). This adaptive detection allows users to fine-tune sensitivity to market noise across different timeframes.
ZigzagSR supports trend confirmation by distinguishing impulsive versus corrective swings, aids in identifying precise entry, stop-loss, and take-profit zones, and facilitates strategy development by providing clear labels and lines usable in automated or manual trading systems. Typical use cases include swing trading, breakout confirmation, and combining with other indicators such as RSI or moving averages for enhanced signal validation.
Installation requires adding ZigzagSR to any cTrader chart with no external dependencies, followed by parameter adjustment to fit individual trading styles and timeframes.
Indicator profile
Customer reviews
4.3
Reviews: 3
5 | 33 % | |
4 | 67 % | |
3 | 0 % | |
2 | 0 % | |
1 | 0 % |
Customer reviews
November 9, 2025
ZigzagSR combines classic wave mapping with auto S/R zones. Clean, responsive, and great for spotting turning points. A must-have for structure-focused traders. Could use alerts for new high/low formations, but performance and clarity are top-notch.
July 6, 2025
the review gets easier when it adds a check without pretending to know everything, and It needs a boring test before bigger size.
Discussion
FAQ
Breakout
Commodities
RSI
XAUUSD
Products available through cTrader Store, including trading bots, indicators and plugins, are provided by third-party developers and made available for informational and technical access purposes only. cTrader Store is not a broker and does not provide investment advice, personal recommendations or any guarantee of future performance.


Price
Since 22/11/2024
136
Sales
2.61K
Free installs