
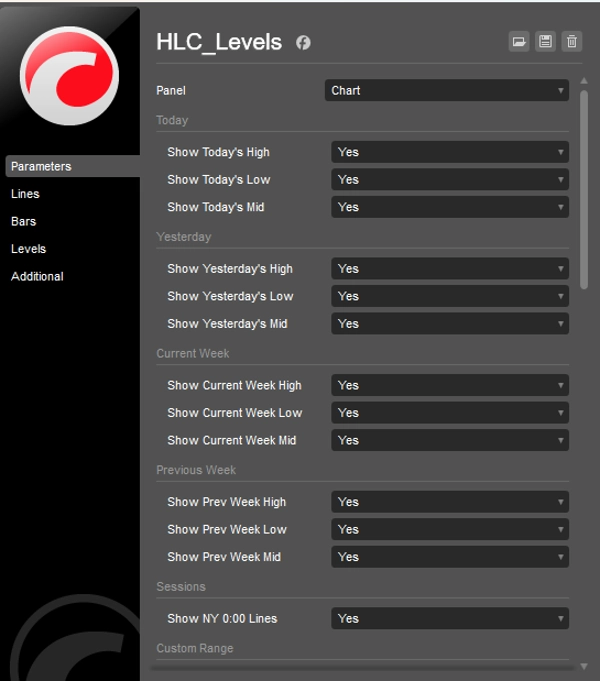
HLC_Levels
Indicator
4 purchases
Version 1.0, Feb 2026
Windows, Mac
4.3
Reviews: 3
Description
Description:
Stop drawing lines manually every day. Advanced HLC & Session Levels is a comprehensive indicator designed for professional traders who rely on institutional reference points. Whether you trade Price Action, ICT concepts, or Breakout strategies, this tool keeps your chart clean and your levels precise.
Key Features:
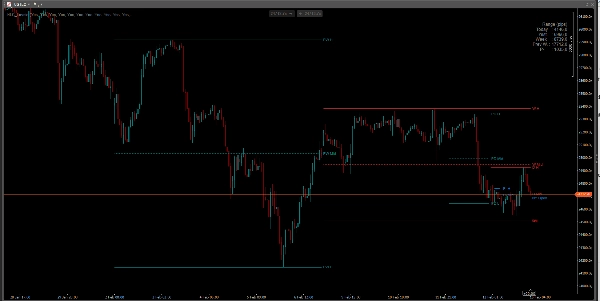
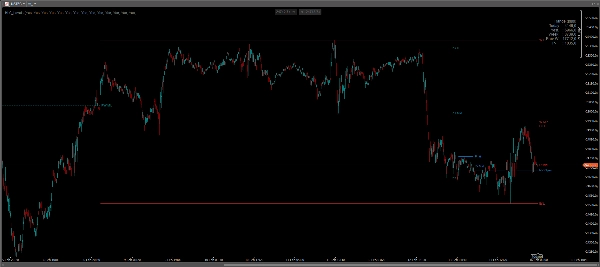
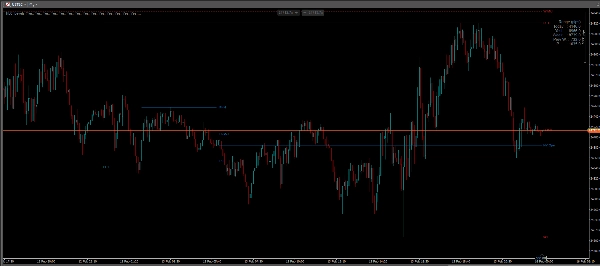
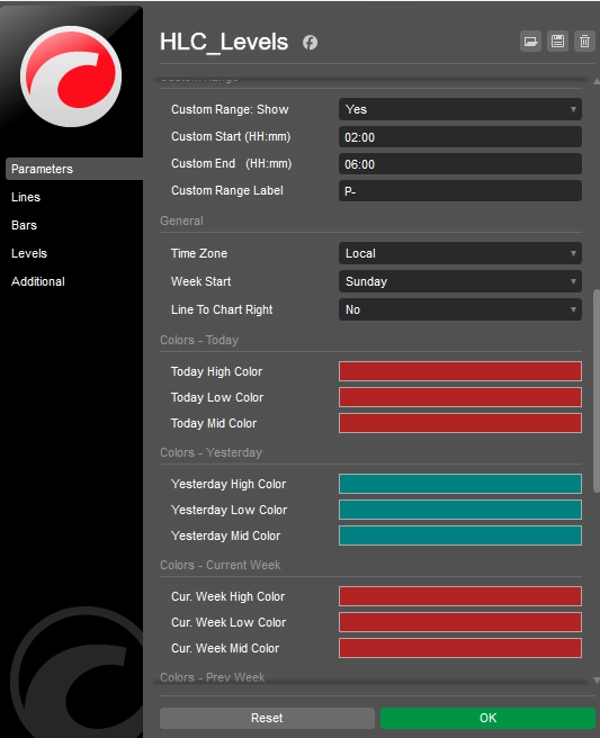
- Daily Levels: Automatically displays Today's and Yesterday's High, Low, and Mid (50%) levels.
- Weekly Levels: Visualizes Current and Previous Week's High, Low, and Mid levels.
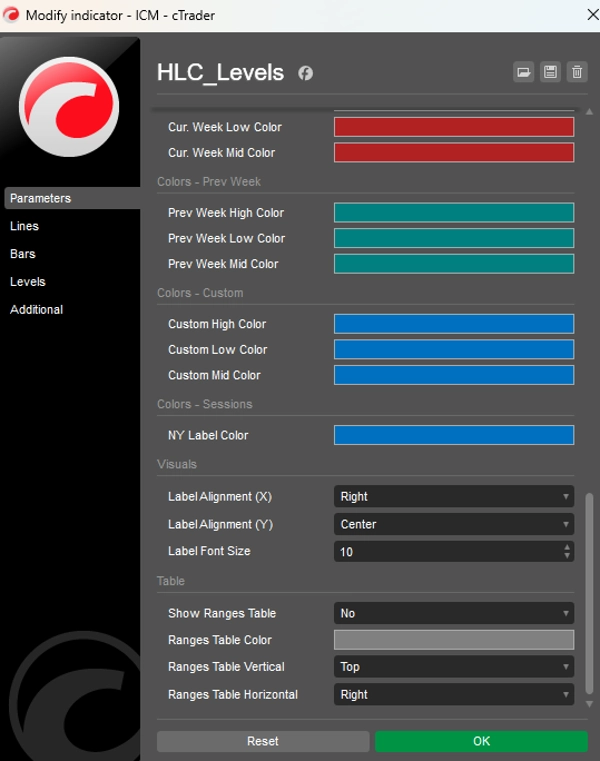
- NY Midnight Open: A dedicated toggle for the institutional New York 00:00 price level (True Day Open), crucial for directional bias.
- Custom Range / Session: Define your own time window (e.g., Asia Session, London Open, or Initial Balance). The indicator will draw the High, Low, and Mid for that specific period.
- Volatility Dashboard: An on-chart table showing the pip range (High minus Low) for Day, Yesterday, Week, Previous Week, and your Custom Range.
- Time Zone Intelligence: Works with Broker time, UTC, NY, or Local time to ensure levels align with your strategy.
Why use this indicator?
- Reaction Points: Old Highs/Lows and Midpoints often act as strong support and resistance.
- Mid (Equilibrium): The 50% level is key for identifying "Discount" vs "Premium" pricing.
- Fully Customizable: Toggle any line on/off. Change colors, line styles, and label positions to match your template.
Settings:
- Enable/Disable specific timeframes (Today, Yesterday, Week, Prev Week).
- Custom Start/End times for specific session ranges.
- "Extend Lines" option to project levels to the future.
- Custom colors for every group of lines.
Summary
Indicator profile
Customer reviews
4.3
Reviews: 3
5 | 33 % | |
4 | 67 % | |
3 | 0 % | |
2 | 0 % | |
1 | 0 % |
Customer reviews
May 16, 2026
Bit weird to see there is no Close level eventhough it's called HLC_levels.. There is a high and low and a mid, but no close. I kinda find it essential to have a close though. Other than that is safes me huge amount of time daily to not set all these levels manually. So besides the lack of the close level i still like this indicator. Would love to see a new version with the added close level as the name suggests
March 2, 2026
A 5 minute check should not become a 30 minute rabbit hole, and the entry needs one more reason to make sense.
February 21, 2026
most of the value comes from the decision gets a little more breathing room. The market context still matters.
Discussion
FAQ
Prop
Forex
Scalping
Indices
SMC
AI
XAUUSD
NAS100
USDJPY
Products available through cTrader Store, including trading bots, indicators and plugins, are provided by third-party developers and made available for informational and technical access purposes only. cTrader Store is not a broker and does not provide investment advice, personal recommendations or any guarantee of future performance.


Price
24
Sales
662
Free installs