


Description
TP_SL Very useful Risk & Reward Tool (TradingView Style)
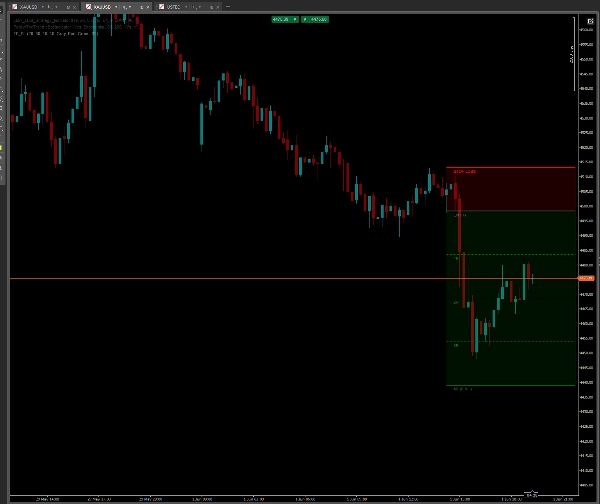
Bring the ultimate TradingView-style Long/Short Position tool directly to your cTrader charts!
If you have ever missed a fast, intuitive, and interactive drawing tool to plan your trades, calculate risk, and project Take Profit levels visually, this indicator is for you. Designed for speed and clean chart aesthetics, it allows you to map out your trade setups in less than a second.
🔥 Key Features:
- TradingView Experience in cTrader: Replicates the popular visual Long/Short position tool.
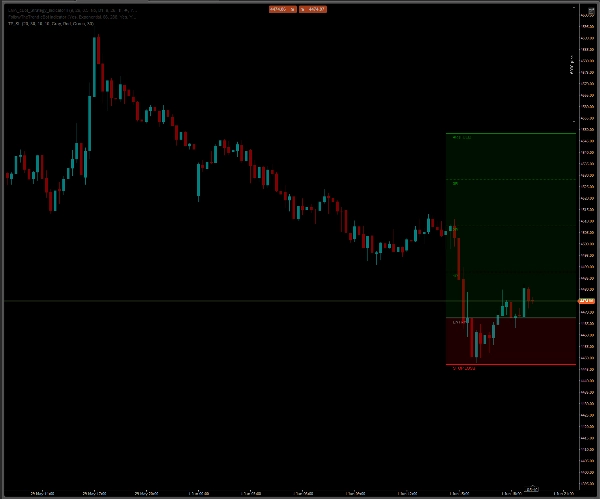
- Smart Auto-Flip (Long/Short): Seamlessly switches between Long and Short positions. Simply drag the Stop Loss line above your Entry line, and the Take Profit zones will instantly flip to the downside.
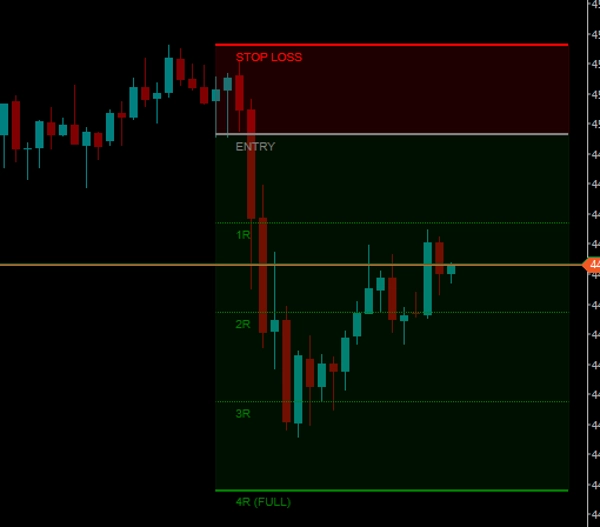
- Automatic Risk Multiples (R-Math): Automatically calculates your risk (1R) based on the distance between Entry and Stop Loss, and dynamically projects precise Take Profit levels for 1R (Risk Free), 2R, 3R, and 4R (Full TP).
- Clean Chart Technology: Unlike standard horizontal lines that shoot infinitely to the left and clutter your historical data, this tool uses bounded lines. It creates a neat, self-contained block that stays exactly where you need it.
- Dynamic Price Tracking: As new candles print, the tool automatically "floats" to the right, staying close to the current price action.
⚡ How to Use It:
- Draw: Hold down the SHIFT key and Left-Click anywhere on the chart. The setup will appear instantly.
- Adjust: Simply Drag & Drop the grey "ENTRY" line or the red "STOP LOSS" line to your desired price levels. The entire grid calculates and adjusts in real-time.
- Delete: Click on either the Entry or Stop Loss line and press the Delete key on your keyboard. The indicator features an auto-cleanup function that will instantly remove the entire drawing, leaving zero mess behind.
⚙️ Fully Customizable Settings:
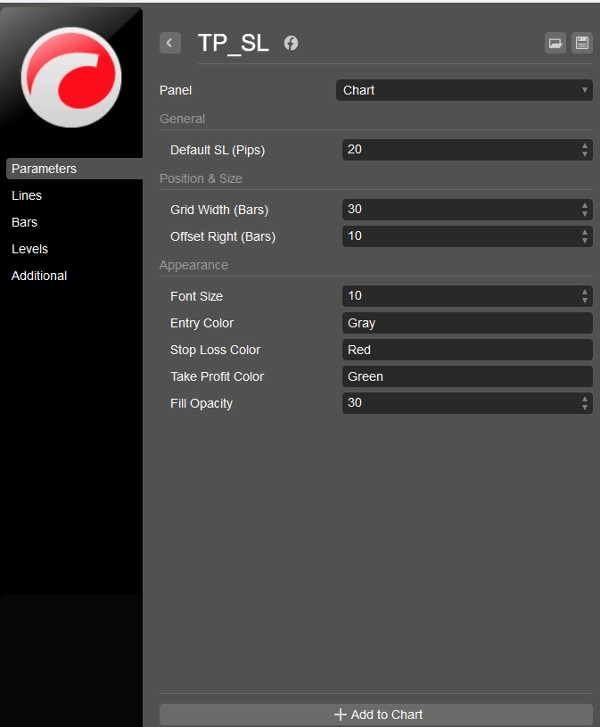
- Grid Width & Offset: Adjust the length of the tool (in bars) and how close it sits to the current price.
- Visuals: Full control over colors. Type any standard color name (e.g., DodgerBlue, Orange, Gray) for Entry, SL, and TP lines.
- Opacity: Adjust the transparency of the background zones (from 0 to 255) for a sleek, glass-like look.
- Text Size: Make the on-chart labels fit perfectly with your screen resolution.
Stop guessing your targets. Visually plan your trades, respect your risk management, and keep your charts perfectly clean!
This indicator is completely FREE for the cTrader community.
Summary
AI summary
TP_SL is a visual risk and reward indicator designed for cTrader that replicates the TradingView-style Long/Short position tool. It enables traders to quickly and intuitively plan trades by drawing and adjusting entry, stop loss, and take profit levels directly on the chart. The tool automatically calculates risk multiples (1R, 2R, 3R, 4R) based on the distance between entry and stop loss, projecting precise take profit zones.
Key features include a smart auto-flip function that switches between long and short positions by dragging the stop loss line above or below the entry line, clean bounded lines that avoid cluttering historical data, and dynamic price tracking that keeps the tool aligned with current price action. Users can draw the setup by holding SHIFT and left-clicking, then adjust levels with drag-and-drop, and delete the drawing with a single key press.
The indicator offers full customization of grid width, offset, colors, opacity, and text size to fit individual chart preferences. It supports visualization on bar-based data and is categorized under pattern indicators with a focus on key levels. TP_SL aims to facilitate precise trade planning and risk management while maintaining clean chart aesthetics.
Key features include a smart auto-flip function that switches between long and short positions by dragging the stop loss line above or below the entry line, clean bounded lines that avoid cluttering historical data, and dynamic price tracking that keeps the tool aligned with current price action. Users can draw the setup by holding SHIFT and left-clicking, then adjust levels with drag-and-drop, and delete the drawing with a single key press.
The indicator offers full customization of grid width, offset, colors, opacity, and text size to fit individual chart preferences. It supports visualization on bar-based data and is categorized under pattern indicators with a focus on key levels. TP_SL aims to facilitate precise trade planning and risk management while maintaining clean chart aesthetics.
Indicator profile
Indicator category
Pattern
Output type
Visualisation
Data requirements
Bars only
Customer reviews
0.0
Reviews: 0
Customer reviews
No reviews for this product yet. Already tried it? Be the first to tell others!
Discussion
FAQ
Key Levels
Products available through cTrader Store, including trading bots, indicators and plugins, are provided by third-party developers and made available for informational and technical access purposes only. cTrader Store is not a broker and does not provide investment advice, personal recommendations or any guarantee of future performance.



























Price
32
Sales
980
Free installs