present
Sign up and get $50 off your first purchase
Trading product for Corex Smart Bear Bull Indicator Key Levels RSI, image 1
Corex Smart Bear Bull
Indicator
Version 1.0, Sep 2026
Windows, Mac
Trading product for Corex Smart Bear Bull Indicator Key Levels RSI, image 2
Trading product for Corex Smart Bear Bull Indicator Key Levels RSI, image 3
Trading product for Corex Smart Bear Bull Indicator Key Levels RSI, image 4
Trading product for Corex Smart Bear Bull Indicator Key Levels RSI, image 5
Trading product for Corex Smart Bear Bull Indicator Key Levels RSI, image 6
Trading product for Corex Smart Bear Bull Indicator Key Levels RSI, image 7
Trading product for Corex Smart Bear Bull Indicator Key Levels RSI, image 8
Trading product for Corex Smart Bear Bull Indicator Key Levels RSI, image 9
Trading product for Corex Smart Bear Bull Indicator Key Levels RSI, image 10
Trading product for Corex Smart Bear Bull Indicator Key Levels RSI, image 11
3
Sales
11
Free installs

Description

Corex Smart Bear Bull reads the trend in two layers: a fusion line for the direction, and a Williams %R engine for the moments to act inside it.


THE FUSION LINE


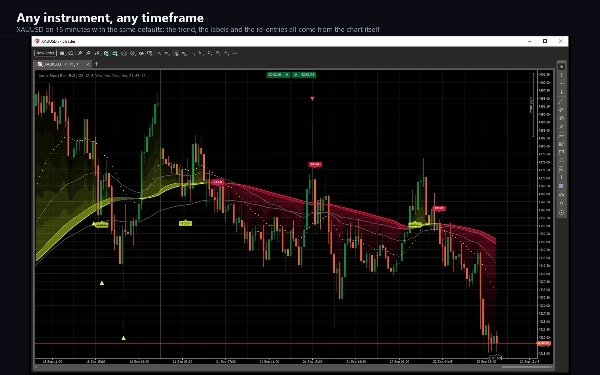
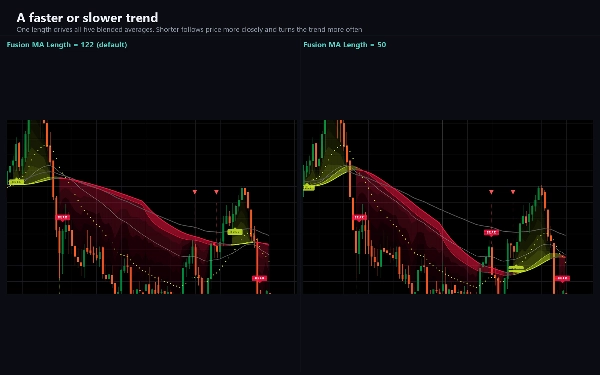
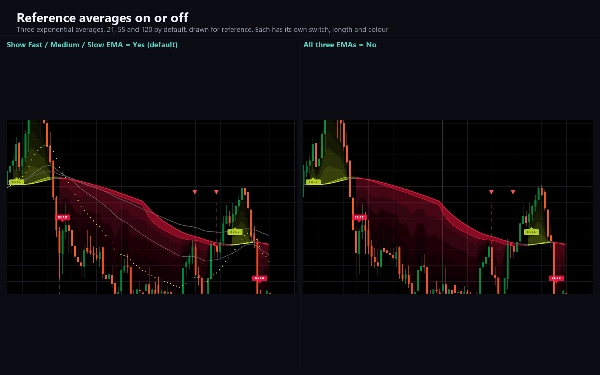
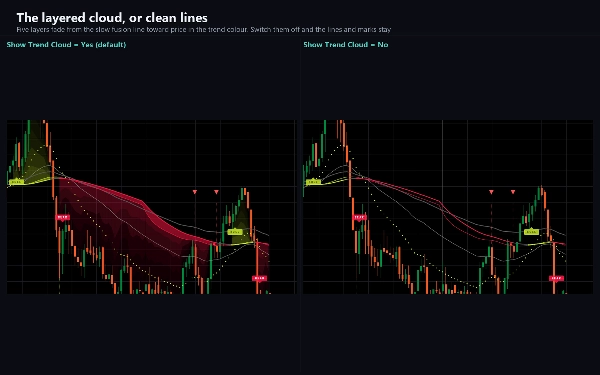
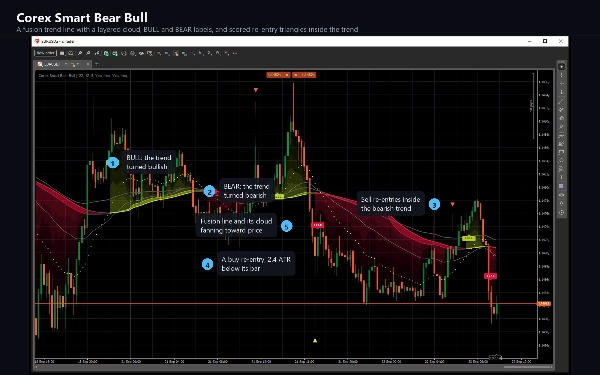
Five moving averages of the same length - exponential, simple, weighted, Arnaud Legoux and the session VWAP - are blended into one and smoothed into a slow and a fast line. The market is bullish while price closes above a rising slow line, bearish while it closes below a falling one, and neutral otherwise; both lines take the colour of that state. A layered cloud fans out from the slow line toward price in the trend colour, fading layer by layer, and a band between the slow and fast lines shows which of them leads.


TREND LABELS


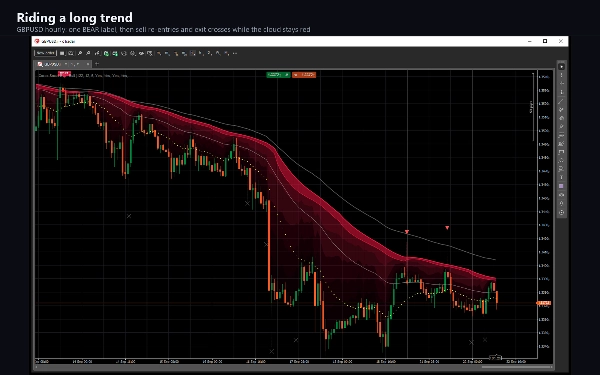
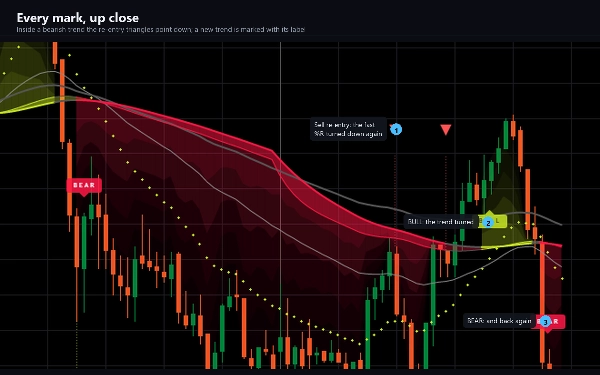
A BULL label appears under the bar where the market turns bullish, and a BEAR label above the bar where it turns bearish. A cooldown keeps two labels in one direction a set number of bars apart.


RE-ENTRY TRIANGLES AND EXITS


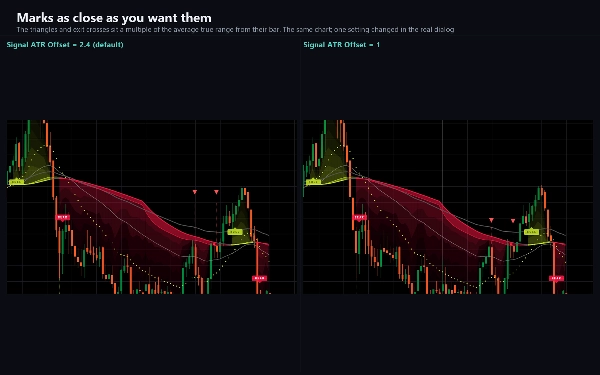
While the market is bullish, a lime triangle under a bar marks a buy re-entry; while it is bearish, a red triangle above a bar marks a sell re-entry. They come from a Williams %R engine with three periods: a fast line crossing out of its oversold or overbought zone triggers a candidate, and five kinds of trigger are recognised - snap from an extreme, exhaustion, continuation, pullback, and all three lines stretched at once. Each candidate is scored from 0 to 100 on the readings, the pace of the move, the trading session, the position against the 50 and 200 averages, RSI and volume; several triggers on one bar add a bonus, and a minimum score filters out the weak ones. A trend gate blocks counter-trend candidates while the slower lines show a strong trend, unless the fast line has already recovered from an extreme. After a re-entry, the first opposite signal inside the trend marks an exit with a gray cross. Each mark sits a multiple of the average true range away from the bar, joined to it by a dotted line.


SETTINGS


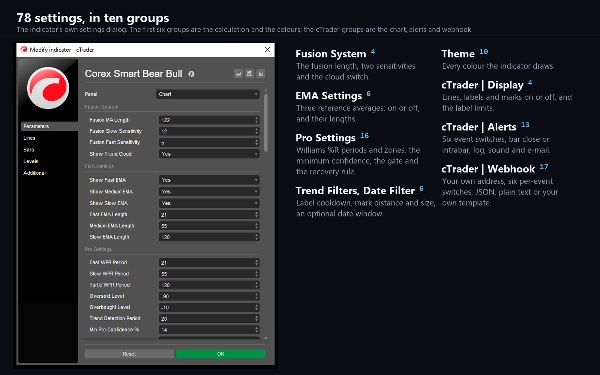
The fusion length and its two sensitivities, the three reference averages, the three Williams %R periods and their zones, the minimum confidence, the gate and its levels, the recovery rule, the label cooldown, the mark distance and size, an optional date window, and ten colours. Each drawing element has its own switch, and switching one off changes the drawing only: the values, alerts and webhook carry on.


ALERTS AND WEBHOOK


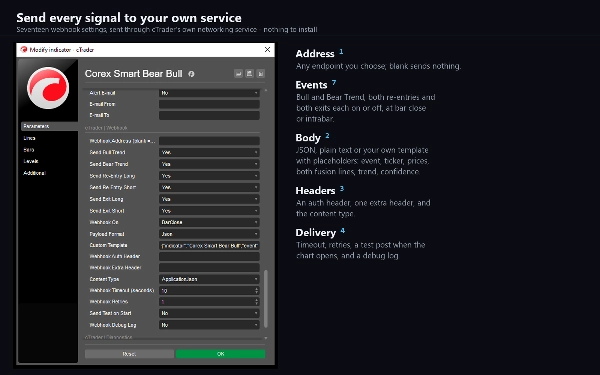
Six events: Bull Trend, Bear Trend, Re-Entry Long, Re-Entry Short, Exit Long and Exit Short. Each has its own switch and can fire when the bar closes or as soon as the condition is met. Delivery is a log line, a sound or an e-mail. There is also a webhook: enter an address and each event is posted to it as JSON, as plain text, or in a template you write yourself with placeholders for the symbol, timeframe, time, prices, both fusion lines, the trend and both confidence scores. It stays off until you enter one, it sends nothing during the history pass or in a backtest, and it needs no special access rights - posts go out through cTrader's own networking service.


FOR cBOTS


Fourteen output series: both fusion lines, the three averages, the trend, both confidence scores and one series per event.


TYPE AND WINDOW


A trend indicator with signals, drawn on the price chart.


TIMEFRAMES AND INSTRUMENTS


Any time-based timeframe; the defaults read well from M5 to H4. It works on any instrument - forex pairs, metals, indices and crypto. The session VWAP and the volume filter use the broker's tick volume, and the session day opens at 17:00 New York time.


WHO IT IS FOR


Traders who follow a trend and want marked, scored moments to join it or to step aside, with an alert at each one.


NOTES


The marks follow the bar that is still forming, so one can appear and disappear until that bar closes. Alerts and webhook posts default to bar close, where the condition is final. The chart keeps the newest 500 labels and 50 connector lines; a display switch keeps them all.


Trading involves risk. Past performance does not guarantee future results.

Summary

AI summary
Corex Smart Bear Bull is a trend indicator designed for use on price charts across any time-based timeframe, with optimal readability from M5 to H4. It supports various instruments including forex pairs, metals, indices, and cryptocurrencies. The indicator combines five moving averages—exponential, simple, weighted, Arnaud Legoux, and session VWAP—into a fusion line, which is smoothed into slow and fast lines to determine market direction: bullish, bearish, or neutral. A layered cloud visually represents the trend strength and direction.

The indicator features BULL and BEAR labels marking trend reversals, with a cooldown period to space labels. It uses a Williams %R engine with three periods to identify scored re-entry points via colored triangles (lime for buy, red for sell) and exit markers (gray crosses). These signals are scored based on multiple factors including momentum, session, position relative to moving averages, RSI, and volume. A trend gate filters counter-trend signals during strong trends.

Settings allow customization of fusion length, sensitivities, reference averages, Williams %R parameters, confidence thresholds, label cooldown, and visual elements. Alerts and webhook notifications are available for six event types, delivering data via log, sound, email, or customizable JSON posts. The indicator outputs multiple data series for integration with cBots.

Indicator profile
Indicator category
Trend
Output type
Visualisation
Signals
Data requirements
Volume
Supported signals
Cross
Reversal
Trend strength

Customer reviews

0.0
Reviews: 0
Customer reviews
No reviews for this product yet. Already tried it? Be the first to tell others!

Discussion

FAQ

Key Levels
RSI
Volume
ATR
Triangle
Moving Average
VWAP
Products available through cTrader Store, including trading bots, indicators and plugins, are provided by third-party developers and made available for informational and technical access purposes only. cTrader Store is not a broker and does not provide investment advice, personal recommendations or any guarantee of future performance.

More from this author

Indicator
ATR
CCI
+4
A trend line that never steps back, a shaded band to the price, and a pointer at the swing where the trend turns.
Indicator
ATR
RSI
+4
RSI bands drawn on price, confluence-scored BUY/SELL signals, an ATR stop with three targets
Indicator
ATR
EMA
+3
EMA cross filtered by a trend average and its ATR channel, with long, short and close marks and colored candles.
Indicator
ADX
ATR
+5
SuperTrend signals scored on five confluence factors, with an ATR stop, three targets and a dashboard.
Indicator
ADX
ATR
+5
Ten confluence layers scored on every closed bar, with an anti-chop gate, pivot levels and a live dashboard.
Indicator
Volume
Key Levels
+1
Fixed-grid volume profile: bull and bear volume at every price level, with Point of Control and value area.
Indicator
ATR
RSI
+4
Adaptive Ichimoku with nine-factor confluence scoring, five signal types, smart TP/SL and an MTF panel.
Indicator
ATR
EMA
+3
EMA trend, RSI reclaim and divergence signals with ATR stop and two targets, swing levels and a 16-row dashboard.
Indicator
ATR
EMA
+2
Eight-EMA ribbon with ATR trade zones, a nine-symbol screener and a five-timeframe trend dashboard.
Indicator
Key Levels
Order Block
+5
Order blocks, fair value gaps, liquidity sweeps and a 24-timeframe signal scanner on one chart.
Indicator
ADX
ATR
+5
EMA-cross signals scored on six confluence layers, with an ATR stop, three targets and a live panel
Indicator
ADX
ATR
+5
Range-filter BUY/SELL flips with an ATR or swing stop, three targets, five confluence stars and a live panel

You may also like

Indicator
RSI
MACD
+2
A straightforward yet effective tool signals entry points for both buying and selling. Include 3 Moving Average
Indicator
Key Levels
Market Structure
+1
HTF Candle Projector displays the current Higher Timeframe candle (4H or 1H) as a real projected candle LIVE..
Indicator
Forex
BTCUSD
+5
Auto-plots Open, High, and Low of Day/Week/Month/Year. Session candle counter + Round Numbers. Fully customizable
Indicator
Prop
Forex
+3
Price Change Bundle 3-in-1 Levels • Bars • Histogram. Secret of Price Change
Indicator
ATR
MSS
+3
Stop drawing levels manually. SmartLevels Pro detects, scores & predicts — H4/H1/M15 · cTrader
Indicator
ATR
RSI
+4
Adaptive Ichimoku with nine-factor confluence scoring, five signal types, smart TP/SL and an MTF panel.
Indicator
ATR
RSI
+16
Multi-timeframe trend indicator using EMA, MACD & ADX to confirm high-probability buy and sell bias.
Indicator
Inside Bar
Save time by lighting a candle to look within yourself in another temporality
Indicator
Ichimoku
COMPLETE ALERT SYSTEM - NEVER MISS A SIGNAL AGAIN
Indicator
RSI
BTCUSD
+5
Z-Score: Measures price deviations from its mean. Spots overbought/sold (±2-3 SD) & reversals. Key for stats trading
Indicator
AI
Prop
+7
EMA Clouds, Multi-Timeframe (MTF) Overlay, Swing High/Low detection, and a smart Dashboard with neutral zone filtering.
Indicator
CHOCH
Inducement
+5
TradeLens - Frame the Trade. Refine the Entry. Two Timeframes. One Decision.
Indicator
Prop
Forex
+7
Customizable corner watermark — display symbol, timeframe, broker, or a live candle countdown without cluttering chart
Indicator
ATR
EMA
+2
Dense EMA rainbow + Pro tools & a tested engine — get more from your EMAs, your research base for EMA bots.
Indicator
ADX
ATR
+5
Ten confluence layers scored on every closed bar, with an anti-chop gate, pivot levels and a live dashboard.
Indicator
AI
SMC
+4
Weekly Daily Opening Gaps — NWOG & NDOG Indicator Professional-grade opening gap visualization for institutional traders
Indicator
AI
SMC
+13
Dynamic Liquidity Depth exposes hidden volume
Indicator
Prop
VWAP
+5
Multi-anchor VWAP indicator for cTrader. Plots two VWAP lines (red and blue) with selectable anchors.

Price

3
Sales
11
Free installs