
Engulfing CandlePRO
Indicator
3 purchases
Version 1.0, Feb 2026
Windows, Mac
4.0
Reviews: 1
Description
Engulfing Candle PRO - Professional Engulfing Pattern Detector
Automatically detect Engulfing patterns with Engulfing Candle PRO, a technical indicator that identifies and highlights powerful reversal signals on your chart.
What is an Engulfing Pattern?
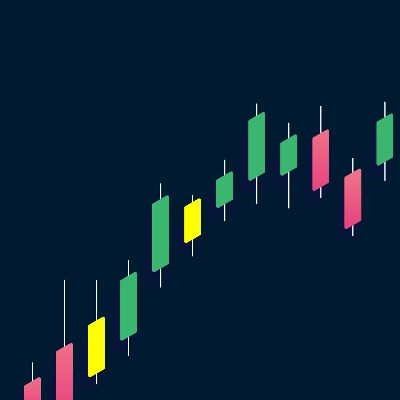
An Engulfing pattern occurs when a candle completely engulfs the range of the previous candle (higher high and lower low), and closes strongly in the direction of the new trend.
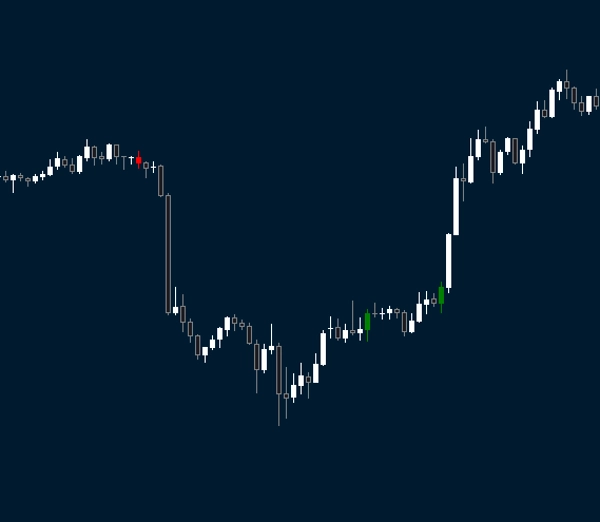
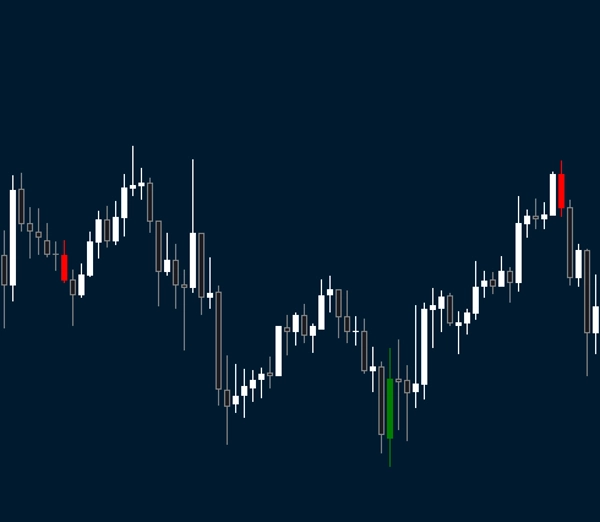
- Bullish Engulfing: A green (up) candle that completely engulfs the prior candle, indicating strong buying pressure and a potential upward reversal.
- Bearish Engulfing: A red (down) candle that completely engulfs the prior candle, indicating strong selling pressure and a potential downward reversal.
Key Features:
- Automatic Real-Time Detection: Instantly spots Bullish and Bearish Engulfing patterns as they form.
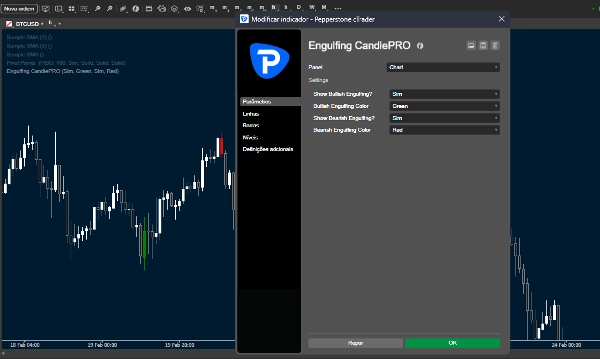
- Independent Controls: Choose to display both patterns or focus solely on Bullish or Bearish setups.
- Visual Highlighting: Customizable colors for both Bullish and Bearish patterns, allowing seamless integration with your chart template.
- Advanced Filtering: Filters out false signals by ensuring the engulfing candle closes purposefully in the trend direction (ignoring Dojis).
- Optimized Performance: Lightweight code for smooth operation across all charts.
Why Use Engulfing Candle PRO?
- Identify Reversals Early: Catch major trend changes right at the turning point.
- Enhance Visual Analysis: Stop straining your eyes looking for subtle candlestick formations.
- Save Time: Let the indicator scan the market for you.
- Improve Trade Entries: Combine with support/resistance for high-probability setups.
Customization:
Choose from 9 different colors to independently highlight Bullish and Bearish Engulfing patterns, adapting the indicator perfectly to your visual style.
Compatibility:
Works on all instruments (Forex, Indices, Stocks, Cryptocurrencies) and any timeframe.
Summary
AI summary
Engulfing Candle PRO is a technical indicator designed to automatically detect Bullish and Bearish Engulfing candlestick patterns, which signal potential trend reversals. It identifies these patterns in real time by recognizing when a candle completely engulfs the previous candle's range and closes decisively in the direction of the new trend. The indicator supports all symbols and timeframes, including Forex, indices, stocks, cryptocurrencies, and more.
Key features include customizable visual highlighting with nine color options for each pattern type, independent controls to display either or both Bullish and Bearish signals, and advanced filtering to reduce false signals by excluding Doji candles. The indicator is optimized for performance to operate smoothly across charts.
Engulfing Candle PRO aims to assist traders in early identification of trend reversals, enhance visual analysis by clearly marking patterns, save time by automating pattern detection, and improve trade entries when combined with support and resistance levels.
Indicator profile
Customer reviews
4.0
Reviews: 1
5 | 0 % | |
4 | 100 % | |
3 | 0 % | |
2 | 0 % | |
1 | 0 % |
Discussion
FAQ
BTCUSD
Forex
Signal
Indices
EURUSD
GBPUSD
NZDUSD
Scalping
Crypto
Stocks
XAUUSD
NAS100
USDJPY
Products available through cTrader Store, including trading bots, indicators and plugins, are provided by third-party developers and made available for informational and technical access purposes only. cTrader Store is not a broker and does not provide investment advice, personal recommendations or any guarantee of future performance.
More from this author


Price
Since 26/10/2025
6
Sales
517
Free installs