

Smart Money Map - JR
Indicator
1 purchases
Version 2.0, May 2026
Windows, Mac
4.0
Reviews: 2

Since 11/02/2026
18
Sales
366
Free installs
Description
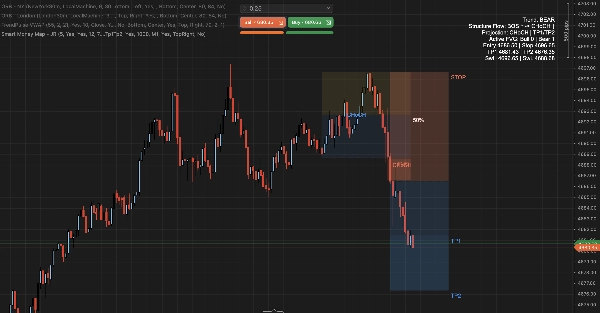
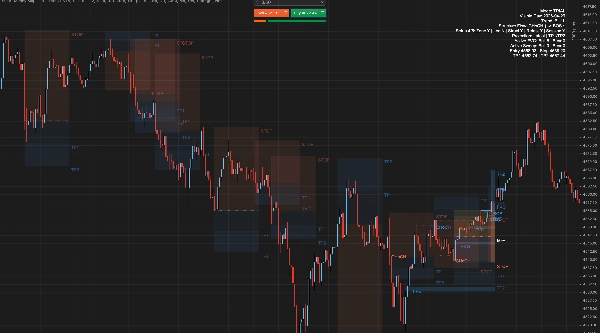
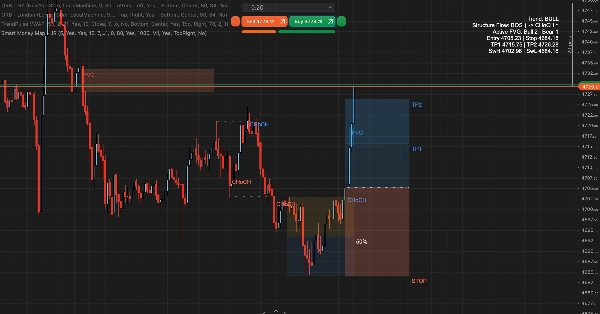
Advanced overlay indicator to highlight key execution context and help aligning structure, location, and risk in one streamlined workflow.
➤ Key Features
- Structure event labeling with configurable sensitivity and confirmation mode
- Active fair value gap mapping with configurable sizing and session filtering
- Liquidity sweep detection for early context (score-only, minimal mode)
- Premium/discount dealing range with 50% equilibrium
- Dynamic entry/stop/target projection box
- Flexible target visualization: single target, split TP1/TP2, or structure-derived targets
- Optional projection label visibility and max-stop cap for tighter intraday control
- Automation-ready output channels for cBot workflows
- Flexible dashboard placement for multi-indicator charts
- Density presets with optional timeframe auto-adjust
➤ How It Works
- Confirms structural swings and tracks directional shift and continuation states.
- Detects liquidity sweeps beyond protected swing levels.
- Maps active imbalance zones and updates them as price interacts with structure.
- Frames current market location with premium/discount context.
- Projects a risk map from current structure state.
- Publishes deterministic event outputs for automation.
➤ Best For
- Intraday SMC charting and execution planning
- Traders who want visual structure and POI context without heavy clutter
- Multi-indicator setups that need configurable dashboard placement
➤ How To Use
- Read structure first using the dashboard trend indicator.
- Use location context to identify premium and discount zones.
- Use active imbalance zones and optional sweep context to refine timing.
- Use the projection map for trade planning reference.
➤ Included Controls
- Structure sensitivity and confirmation mode
- Imbalance sizing, session filtering, and mitigation display behavior
- Dealing range and projection display options
- Projection controls including target mode, anchor mode, label visibility, and optional stop cap
- Density modes: Custom, M1, M5, M15, H1, H4, D1
- Optional automatic density adjustment based on chart timeframe
- Color customization for chart readability
Summary
AI summary
Smart Money Map - JR is an advanced overlay indicator designed for intraday trading to visually highlight key market execution contexts by integrating structure, location, and risk into a streamlined workflow. It identifies and labels structural events with configurable sensitivity and confirmation modes, detects liquidity sweeps beyond swing levels, and maps active fair value gaps with adjustable sizing and session filters. The indicator frames market price zones into premium and discount ranges centered around a 50% equilibrium level.
It features dynamic projection boxes for entry, stop, and target levels, supporting flexible target visualization options including single targets, split take-profits, or structure-derived targets. Users can control projection label visibility and apply maximum stop caps for tighter intraday risk management. The tool supports automation through deterministic event outputs compatible with cBot workflows and allows customizable dashboard placement for multi-indicator chart setups. Density presets with optional automatic timeframe adjustment enhance adaptability across different chart resolutions.
The indicator operates by confirming structural swings, tracking directional shifts, detecting liquidity sweeps, updating imbalance zones as price interacts with structure, and projecting a risk map based on current market conditions. It is suited for traders seeking clear visual structure and points of interest without chart clutter, particularly those focused on Smart Money Concepts (SMC) and market structure analysis.
It features dynamic projection boxes for entry, stop, and target levels, supporting flexible target visualization options including single targets, split take-profits, or structure-derived targets. Users can control projection label visibility and apply maximum stop caps for tighter intraday risk management. The tool supports automation through deterministic event outputs compatible with cBot workflows and allows customizable dashboard placement for multi-indicator chart setups. Density presets with optional automatic timeframe adjustment enhance adaptability across different chart resolutions.
The indicator operates by confirming structural swings, tracking directional shifts, detecting liquidity sweeps, updating imbalance zones as price interacts with structure, and projecting a risk map based on current market conditions. It is suited for traders seeking clear visual structure and points of interest without chart clutter, particularly those focused on Smart Money Concepts (SMC) and market structure analysis.
Indicator profile
Indicator category
Market structure (SMC)
Output type
Visualisation
Data requirements
Bars only
Supported signals
Trend strength
Level break
Level touch
Customer reviews
4.0
Reviews: 2
5 | 0 % | |
4 | 100 % | |
3 | 0 % | |
2 | 0 % | |
1 | 0 % |
Discussion
FAQ
Premium/Discount
MSS
BOS
CHOCH
Market Structure
Products available through cTrader Store, including trading bots, indicators and plugins, are provided by third-party developers and made available for informational and technical access purposes only. cTrader Store is not a broker and does not provide investment advice, personal recommendations or any guarantee of future performance.


















Price
Since 11/02/2026
18
Sales
366
Free installs