

Description
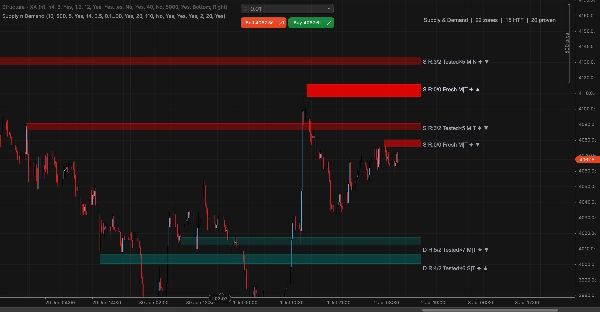
Supply and Demand zone detection from swing pivots, with multi-timeframe confluence and volume filtering. Zones project 20 bars forward and track every retest and breakout - zone opacity fades as it ages, MTF-confluent zones get a solid border, and role reversal flips broken zones to the opposite side.
Each zone has a compact label with all quality signals: S/D type, retest/breakout counts, freshness (Fresh/Tested×N), explosiveness (Strong/Moderate/Weak), base tightness (Tight/Normal/Wide), HTF confluence (✦), and volume at formation (▲/▼). Fresh + ✦ + ▲ zones are the highest quality - untouched, confirmed by H4 structure, and formed on elevated volume.
➤ FEATURES
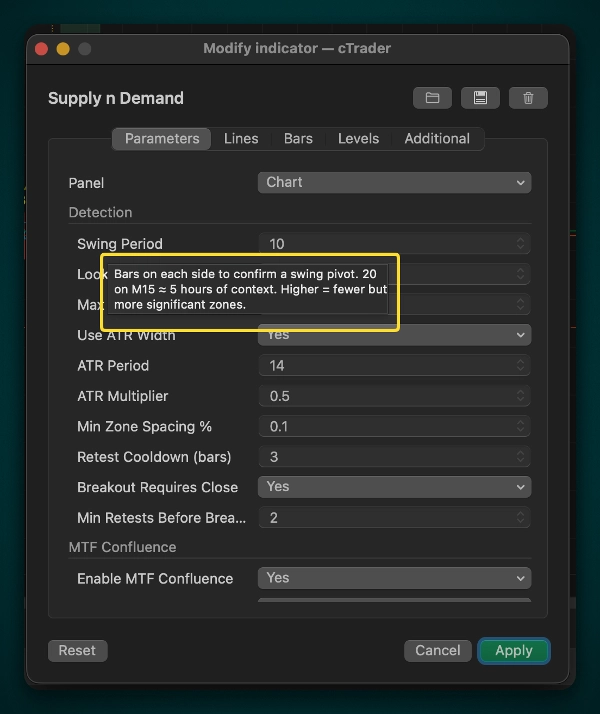
• Swing pivot detection with configurable period (default 20 on M15)
• H4 HTF hard gate — only zones overlapping H4 structure are created (optional)
• Multi-touch protection — zones must survive N retests before breakout is counted
• Volume filter — zones formed on above-average tick volume get ▲ tag
• Zone flip / role reversal — broken Supply becomes Demand (and vice versa)
• Visual fade — opacity decreases with touches; global fade% controls transparency
• TrendLine boundary borders — clipped to zone extent, stronger for HTF zones
• Compact dashboard — zone count, HTF count, proven zone count at top-right
• Proven zone preservation — zones with 3+ touches never expire
➤ PARAMETER GROUPS
Detection — Swing Period, ATR multiplier/size, breakout rules, retest cooldown
MTF Confluence — H4 reference, HTF hard gate toggle, HTF swing/lookback
Volume Confluence — volume MA, threshold %, low-vol suppression
Style — colors, border thickness, label visibility
Visual — global fade%, dashboard toggle
➤ TRADING WORKFLOW
1. Identify high-quality zones: Fresh, ✦, ▲, Tight base
2. Wait for price to reach the zone — do NOT enter on touch alone
3. Wait for candle confirmation (engulfing, pin bar, hammer at Demand; shooting star, engulfing at Supply)
4. Stop loss beyond zone boundary + buffer; TP at next opposing zone
5. For flips: wait for retest AFTER the breakout, then confirmation candle
➤ RECOMMENDED SETTINGS
• Scalping (M1-M5): Swing=8, ATR=1.0, HTF=H1, RequireHTF=false
• Intraday (M15-M30): Swing=20, ATR=1.5, HTF=H4, RequireHTF=true (default)
• Swing (H1-D1): Swing=20, ATR=2.0, HTF=D1/W1, RequireHTF=true
➤ READING THE LABEL
Each zone has a label at its right edge with compressed quality info. Example: S R:3/2 Tested×5 M|N ✦ ▼
Breakdown
- S / D - Supply (resistance) or Demand (support)
- R:3/2 - Retests:3 / Breakouts:2 — zone held 3 times, broken 2 times
- Tested×5 - Total touches (retests + breakouts = 5) — freshness indicator
- M|N - Explosiveness|Base: M=Moderate, N=Normal base width
- ✦ - HTF confluence confirmed — zone overlaps an H4 zone of the same type
- ▼ / ▲ - Volume at formation: ▲=above average (strong), ▼=below average (weaker)
How to Read Zones at a Glance
- Fresh + ✦ + ▲ — highest quality: untouched, confirmed by higher timeframe, formed on elevated volume
- Tested×5-7 — zone has been worked multiple times, probability of holding decreases with each touch
- The more transparent (faded) a zone — the lower the formation volume or the more touches it has. Visual alpha instantly shows which zones are "worn out"
This indicator is for analysis only. It does not place trades. Always test on a demo account before going live.
Summary
Each zone features a compact label displaying key quality signals: zone type (Supply or Demand), retest and breakout counts, freshness, explosiveness, base tightness, higher timeframe confluence, and volume at formation. Zones formed on above-average tick volume and confirmed by H4 structure are marked as highest quality.
Key features include configurable swing pivot detection, optional H4 hard gate filtering, multi-touch protection requiring zones to survive multiple retests before breakout recognition, volume-based filtering, visual fading of zones with age or touches, and preservation of proven zones with three or more touches. A compact dashboard shows zone counts and quality metrics.
Parameters cover detection settings, multi-timeframe and volume confluence, visual style, and dashboard options. Recommended settings vary by trading style, from scalping to swing trading. The indicator provides visual support and resistance levels with detailed quality metrics for analysis but does not execute trades.
Customer reviews
5 | 100 % | |
4 | 0 % | |
3 | 0 % | |
2 | 0 % | |
1 | 0 % |

Discussion
FAQ



















Price