
Description
WHAT IT DOES
Supertrend Moving Average addresses a core limitation of traditional moving averages: fixed periods that never adapt to how trends actually unfold.
Short periods react quickly but get whipsawed. Long periods smooth noise but lag badly during strong moves. No matter the setting, you’re forced to guess a number and hope the market cooperates.
This indicator removes that guesswork.
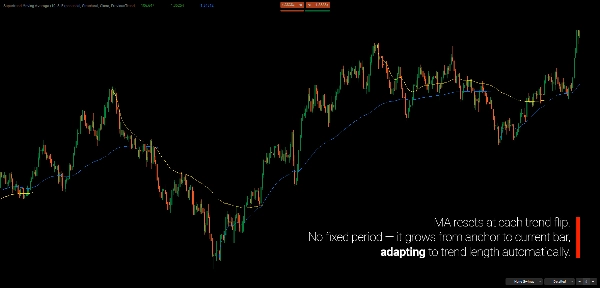
Instead of averaging price over an arbitrary number of bars, it calculates the moving average from the moment the current trend structurally begins. The longer the trend lasts, the longer the MA naturally becomes. Short trends stay responsive. Extended trends become smoother — automatically.
The result is a moving average that grows with the trend, not against it.
Anchored to Supertrend-based structural changes, this MA adapts to market rhythm in real time, without optimization, curve-fitting, or manual tuning. The structure defines the period — not the trader.
WHY STRUCTURAL SUPERTREND?
The original Supertrend flips direction when price closes beyond its band. This works well in clean trends but creates a common frustration: false signals during choppy conditions.
The Problem
A single volatile candle closing slightly beyond the band triggers a flip — even when the broader trend remains intact. Traders following original Supertrend often experience:
- Whipsaws during consolidation
- Premature exits from valid trends
- Re-entries at worse prices after false reversals
The Solution
Structural Supertrend extends the original Supertrend concept to better reflect structural shifts rather than momentary volatility. It filters out noise by waiting for confirmation that a genuine directional change has occurred.
The result is fewer false flips and better alignment with actual trend changes.
Why Keep Both?
The original Supertrend isn't useless — it's answering a different question.
- Structural shows the major trend (the "big picture")
- Original shows momentum shifts within that trend (impulse vs. correction)
When both lines align: strong directional conviction. When they diverge: the move may be corrective, not a true reversal.
This dual-layer view gives you context that neither line provides alone.
THE CORE CONCEPT
Traditional MAs answer: "What's the average price over N bars?"
This indicator answers: "What's the average price since the current trend began?"
The MA is built directly on Supertrend:
- Supertrend detects a trend flip
- The indicator finds the extreme close of the previous trend (highest for new downtrend, lowest for new uptrend)
- MA anchors to that point and calculates forward to current bar
- When Supertrend flips again, the MA resets to a new anchor
The Supertrend defines the trend. The MA measures it. They work as a single system — not separate tools.
You choose which Supertrend drives the MA:
- Structural — fewer resets, tracks major trend
- Original — more resets, tracks shorter-term momentum
KEY FEATURES
Dual Supertrend Analysis
- Structural Supertrend identifies major trend direction using a structurally adapted Supertrend model
- Original Supertrend reveals impulse vs. corrective behavior within the trend
- Visual comparison shows when both agree (conviction) vs. diverge (caution)
Adaptive Anchor-Based Moving Average
- MA automatically anchors to the extreme close of the previous trend
- Period grows dynamically from anchor point — no fixed settings required
- Three MA types: Simple, Exponential, Arnaud Legoux (ALMA)
- Color-coded by trend direction for instant bias recognition
Multi-Timeframe Context
- Apply MA calculation to higher timeframe Supertrend while viewing lower timeframe charts
- See Daily trend MA on your H1 chart without switching timeframes
- Automatic bar requirement detection with clear warnings
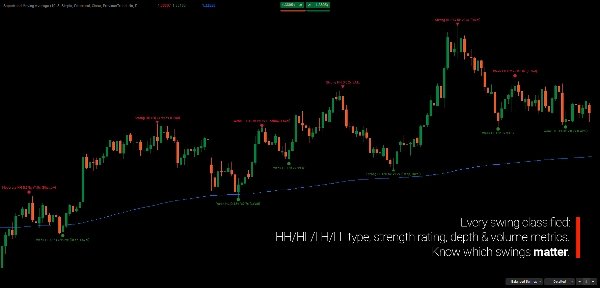
Integrated Swing Detection
- Three detection modes: Minor, Balanced, Major
- Swing strength classification (Weak, Moderate, Strong)
- HH/HL/LH/LL labels confirm trend structure
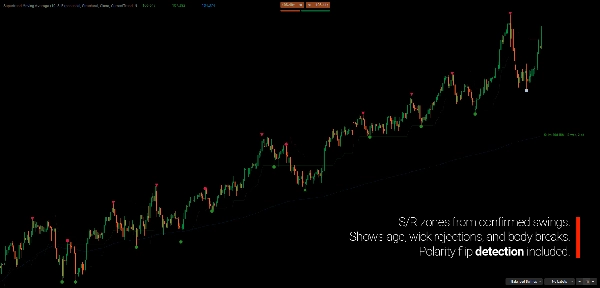
- Optional S/R zones with polarity flip tracking
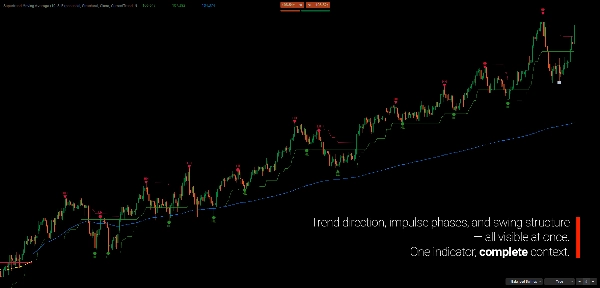
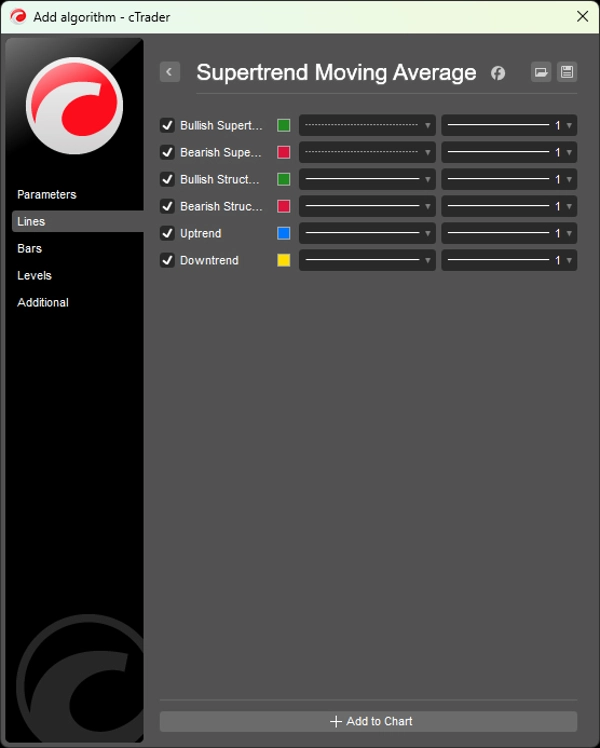
READING THE CHART
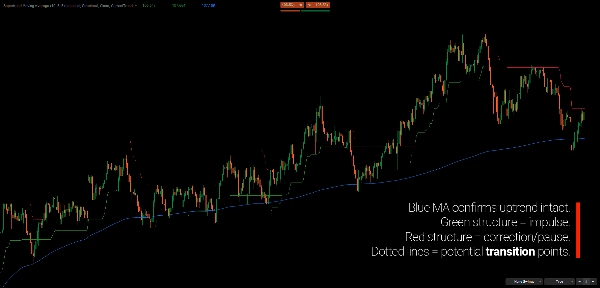
- Green Structure Line: Bullish structural trend (support)
- Red Structure Line: Bearish structural trend (resistance)
- Dotted Line: Original Supertrend — shows when structure differs from classic
- Blue MA: Uptrend average from anchor
- Yellow MA: Downtrend average from anchor
- Swing Markers: Confirmed turning points with strength icons
Trend Alignment Check:
- Structure + Original agree → High conviction move
- Structure + Original diverge → Potential correction or transition
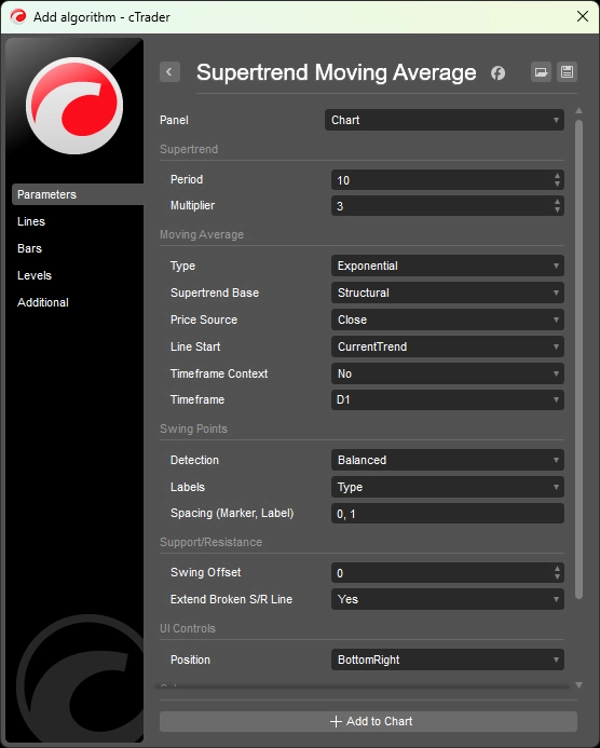
PARAMETERS
Supertrend
- Period (default: 10)
- Multiplier (default: 3.0)
Moving Average
- Type: None, Simple, Exponential, Arnaud Legoux Moving Average (ALMA)
- Supertrend Base: Structural (default) or Original
- Price Source: Close, Open, High, Low, Median, Typical, Average
- Line Start: Current Trend or Previous Trend
- Timeframe Context: Enable/disable with timeframe selection
Swing Points
- Detection Mode: None, Minor, Balanced, Major
- Label Display: None, Type (HH/LL), Detailed
- Customizable colors and spacing
WHO IT'S FOR
This indicator is designed for traders who think in terms of structure rather than signals.
If you care more about understanding where you are within a trend than chasing perfect entries, this tool was built with you in mind.
It’s well suited for trend and swing traders who want an objective way to track trend development without relying on fixed-period moving averages or constant parameter optimization.
Multi-timeframe analysts will benefit from seeing higher-timeframe structural context directly on execution charts, while discretionary traders can use the anchored MA as a dynamic reference for pullbacks, continuation, and trend exhaustion.
This is not a plug-and-play signal generator. It’s a contextual framework for traders who value clarity, consistency, and structural logic in their decision-making.
WHAT MAKES IT DIFFERENT
Trading decisions often involve a familiar trade-off: fast but noisy, or smooth but late.
This indicator adapts to how the market actually unfolds. Short trends produce responsive MAs. Extended trends naturally evolve into smoother ones. No optimization is required — the structure defines the period.
By comparing Structural and Original Supertrend, the indicator provides clear context for distinguishing between trend continuation and corrective movement within the trend.
---
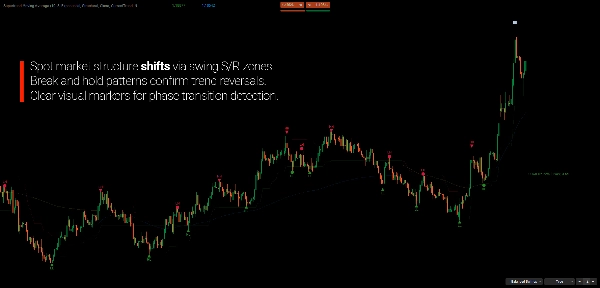
UNDERSTANDING MARKET STRUCTURE
Market structure is the study of how price evolves through sequences of expansion and contraction, rather than isolated candles or indicators. Trends are not defined by single moves, but by the relationship between swings — higher highs and higher lows in uptrends, lower highs and lower lows in downtrends.
From this perspective, a trend is not something to predict, but something to observe and validate. What matters is not whether price is rising or falling on the current bar, but whether the underlying structure remains intact or begins to degrade.
This is why structure-based analysis focuses less on timing perfect entries and more on context: where the market sits within its current phase, whether moves are impulsive or corrective, and how new information fits into the existing structure.
Indicators built around market structure are not meant to replace decision-making, but to support clearer interpretation of what price is already communicating.
---
Trading involves risk. This indicator is a technical analysis tool — always apply proper risk management.
Summary
The indicator integrates dual Supertrend analyses: a Structural Supertrend that identifies major trend direction by filtering out noise and confirming genuine directional changes, and the Original Supertrend that highlights momentum shifts within the trend. Comparing these two provides context for distinguishing strong trend continuation from corrective movements.
Key features include:
- Adaptive anchor-based moving averages with options for Simple, Exponential, or Arnaud Legoux (ALMA) types.
- Multi-timeframe capability to apply higher timeframe Supertrend context on lower timeframe charts.
- Integrated swing detection with configurable modes and strength classification.
- Color-coded trend lines and swing markers for clear visual interpretation.
This tool is suited for trend and swing traders, multi-timeframe analysts, and discretionary traders seeking a structural framework to track trend development and market rhythm objectively. It emphasizes market structure and context over fixed signals, supporting clearer interpretation of price behavior.
Customer reviews
5 | 100 % | |
4 | 0 % | |
3 | 0 % | |
2 | 0 % | |
1 | 0 % |


