
Description
WHAT IT DOES
Fibonacci Channel solves a problem that most Fibonacci tools ignore: where you anchor matters more than what levels you draw.
Most traders apply Fibonacci retracements manually — picking a swing high and swing low, drawing the tool, and hoping the structure holds. The result is a static snapshot that becomes irrelevant the moment price pushes beyond either extreme.
This indicator changes the approach.
Instead of locking to a fixed swing, Fibonacci Channel anchors to a point of your choosing and continuously tracks the highest high and lowest low from that anchor to the current bar. As the range expands, the channel expands with it. The Fibonacci levels always reflect the actual range that has developed — not a historical guess.
The channel grows with the market. The levels stay meaningful.
Direction is tracked automatically. In bullish context, levels measure from the top down. In bearish context, they measure from the bottom up. No manual adjustment needed — the indicator reads the structure and orients accordingly.
WHY ANCHOR-BASED FIBONACCI?
The Problem
Standard Fibonacci tools are drawn between two fixed points. The moment price exceeds either extreme, the tool is no longer valid — you have to redraw it manually. This creates a constant cycle of adjustment, and the Fibonacci map never accurately reflects the full range that has actually developed.
There's a deeper issue too: where you place the anchor defines everything. An arbitrary placement produces arbitrary levels.
The Solution
Fibonacci Channel gives you deliberate control over the anchor point — and then handles everything automatically from there. Place the anchor at a structurally meaningful bar (a trend start, a key reversal, a session open), and the indicator builds the full range forward from that point. Every new high or low the market makes becomes part of the channel. The Fibonacci levels update in real time.
The anchor is draggable. Move it on the chart, and the entire channel redraws instantly.
Why Multiple Modes?
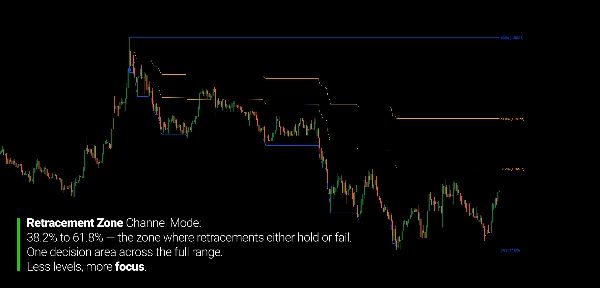
The full Fibonacci grid isn't always what you need. Sometimes the focus is on the retracement zone between 38.2% and 61.8%. Sometimes you want to isolate structure in just the upper or lower half of the range.
Seven distinct channel modes let you apply exactly the level of detail the situation calls for — without cluttering the chart with levels you're not using.
THE CORE CONCEPT
The indicator works in a single forward pass from the anchor:
- You place the anchor icon on a bar of your choosing
- From that bar forward, the indicator tracks the running highest high and lowest low
- The channel boundaries (High Line, Low Line) reflect this expanding range
- Fibonacci levels are calculated within the range, oriented by trend direction
- Move the anchor — the channel recalculates immediately
Trend direction is determined by comparing the current close against the anchor bar's open price. Bullish: levels measure top-down from High. Bearish: levels measure bottom-up from Low. When the market's directional context changes, the channel automatically reorients.
The anchor snaps to bar open times and prices for clean, reproducible placement.
CHANNEL MODES
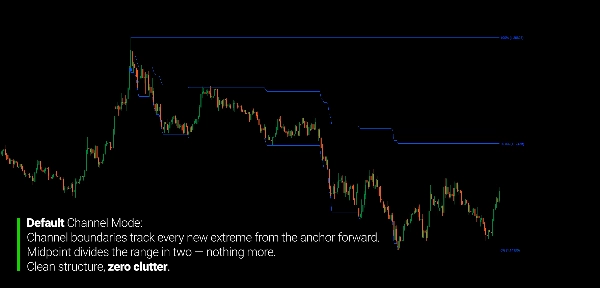
Default High Line, Low Line, and Middle Line only. Clean range boundary view with no internal levels.
Retracement Zone Adds the 61.8% and 38.2% levels — the core retracement zone within the full range. Best for identifying the primary pullback area within a move.
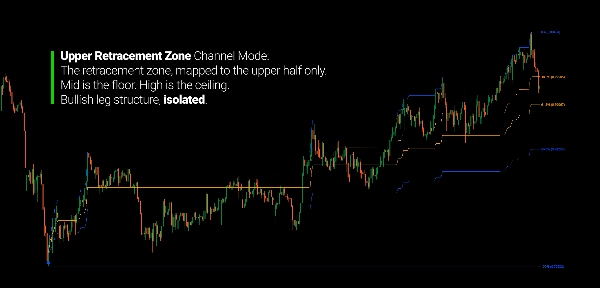
Upper Retracement Zone Retracement zone mapped to the upper half of the channel (between Mid and High). Useful for isolating retracement structure within an upward leg.
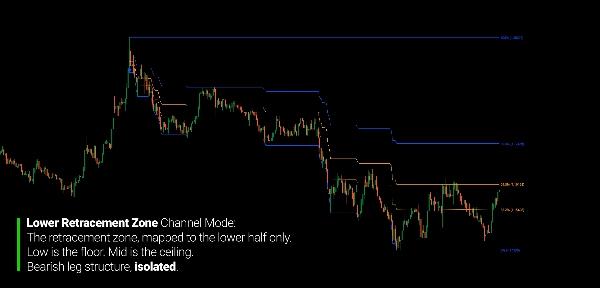
Lower Retracement Zone Retracement zone mapped to the lower half (between Low and Mid). Same logic applied to downward legs.
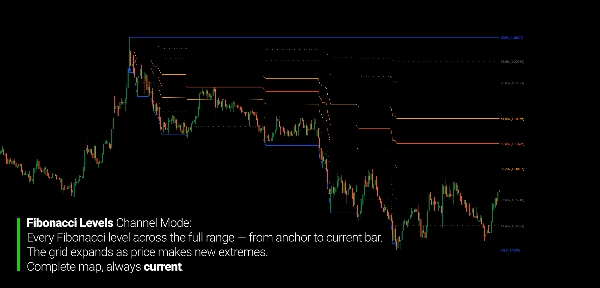
Fibonacci Levels Full Fibonacci grid across the complete range: 88.6%, 78.6%, 61.8%, 50%, 38.2%, 23.6%, 11.4%. For traders who want the complete level map.
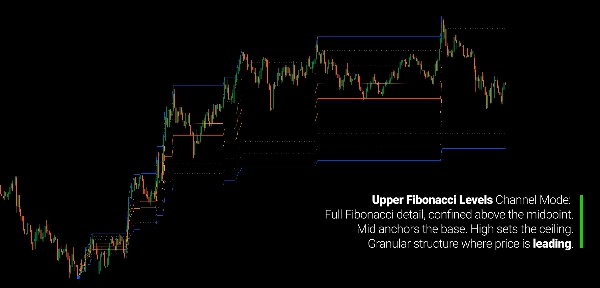
Upper Fibonacci Levels Full Fibonacci grid applied only to the upper half of the channel.
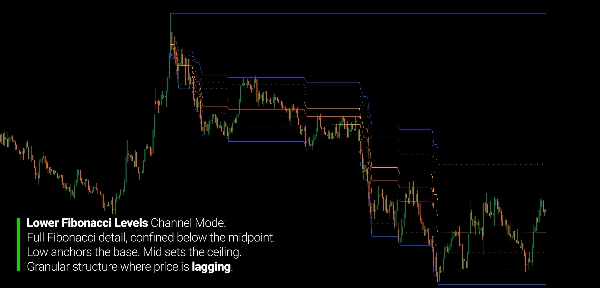
Lower Fibonacci Levels Full Fibonacci grid applied only to the lower half of the channel.
READING THE CHART
- High Line: Upper boundary of the channel (highest high from anchor)
- Low Line: Lower boundary of the channel (lowest low from anchor)
- Middle Line: Midpoint of the full range
- 61.8% / 38.2%: Core retracement zone (orange lines)
- 50%: Mid-retracement level (red-orange)
- 78.6% / 88.6% / 23.6% / 11.4%: Extended Fibonacci levels (gray dotted)
- Anchor Icon: Draggable — move it to redefine where the channel begins
Direction Reference:
- Bullish context → levels orient top-down (High = 0%, Low = 100%)
- Bearish context → levels orient bottom-up (Low = 0%, High = 100%)
- Direction updates automatically when the latest close crosses the anchor open
PARAMETERS
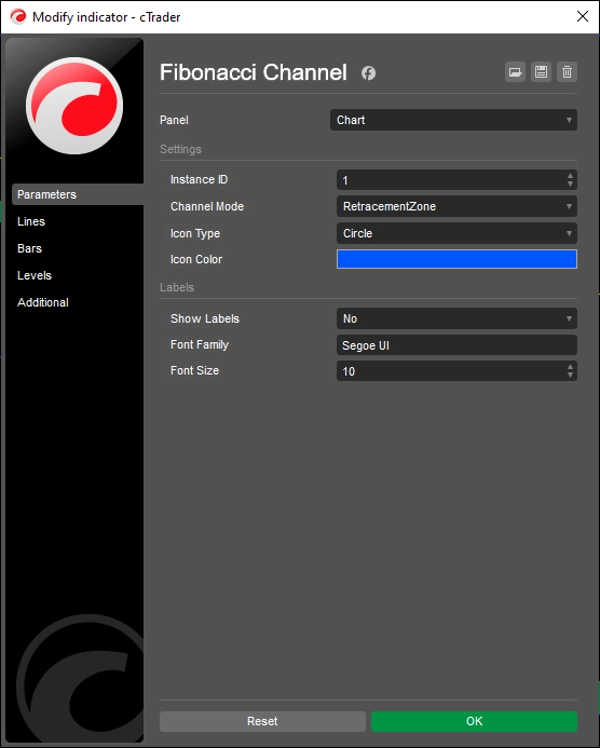
Settings
- Instance ID — supports multiple independent channels on the same chart
- Channel Mode — selects which levels to display (7 modes)
- Icon Type — visual style of the draggable anchor
- Icon Color — color of the anchor marker
Labels
- Show Labels — toggle price labels at each level
- Font Family — label typeface
- Font Size — label size (6–32)
WHO IT'S FOR
This indicator is for traders who use Fibonacci analysis as a structural reference rather than a mechanical signal tool.
If you've spent time redrawing Fibonacci tools every time price makes a new extreme — or found that static retracements stop reflecting the market after the first few bars — this indicator was built to address exactly that.
It's well suited for swing and position traders who want a Fibonacci map that stays valid as price develops, range and structure traders who work with channel boundaries and retracement zones as entry or exit references, and multi-instance users who want to track multiple independent channels across the same instrument simultaneously.
The draggable anchor makes it practical in real-time use: set the channel start at a point that matters structurally, and let the indicator maintain the map from there. No redraws, no manual updates.
This is not a signal generator. It's a structural reference framework for traders who use Fibonacci levels as context — not as entry triggers.
WHAT MAKES IT DIFFERENT
Most Fibonacci tools are static: two fixed points, one fixed map. This one is dynamic — the range expands as price develops, and the levels always reflect the actual range from your chosen anchor to the present bar.
Most Fibonacci implementations require manual direction setup. This one reads bullish and bearish context automatically and orients all levels accordingly — without any parameter changes from the trader.
Most channel tools offer one layout. This one offers seven distinct modes, from a clean boundary view to a full Fibonacci grid applied to the full range or either half independently. The chart shows exactly the level of detail you need for the context you're analyzing.
Multiple instances can run simultaneously with independent anchors — each tracking a different structural segment without interfering with one another.
---
UNDERSTANDING FIBONACCI STRUCTURE
Fibonacci ratios are not predictive. They describe proportional relationships within price ranges — relationships that traders have observed repeating across markets and timeframes for decades. Whether this reflects mathematical properties of markets or simply collective behavior around well-known levels is an open question. What matters for practical use is more straightforward.
A Fibonacci channel defines the range of a move and divides it into proportionally meaningful zones. Traders use these zones to assess whether a pullback is shallow or deep, whether a retracement is holding or failing, and whether price is approaching an area where the structure has historically been significant.
The value of an anchor-based approach is that it keeps the analysis grounded in a specific structural event. The channel doesn't begin at an arbitrary point — it begins where you decide the relevant move started. That decision is yours to make based on your read of the chart. The indicator's role is to maintain the map accurately from that point forward, so the levels remain valid as long as the structure they're measuring remains intact.
---
Trading involves risk. This indicator is a technical analysis tool — always apply proper risk management.
Summary
Customer reviews
5 | 100 % | |
4 | 0 % | |
3 | 0 % | |
2 | 0 % | |
1 | 0 % |


