


Description
Description:
Session VWAP Bands plots a volume-weighted average price anchored to your chosen session (daily reset by default) alongside three tiers of statistical deviation bands — the same fair-value framework used on institutional equity and futures desks, brought to retail forex and CFD charts.
What it analyses: every bar's typical price (high+low+close ÷ 3) weighted by volume, accumulated from the session start. From that it derives the running VWAP and the standard deviation of price around it, then projects 1σ, 2σ, and 3σ bands above and below.
How to read it:
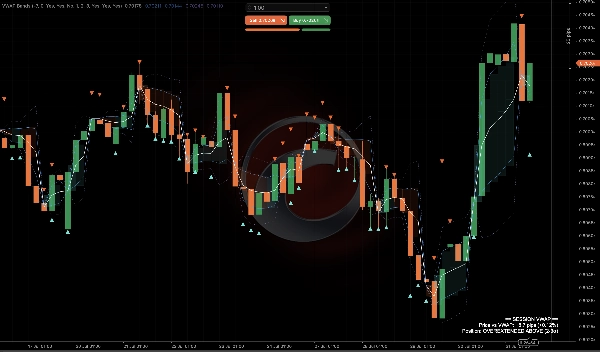
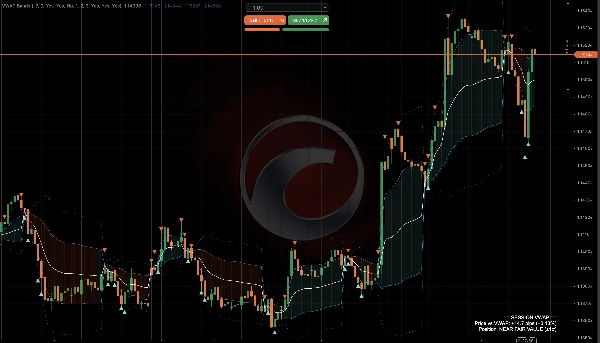
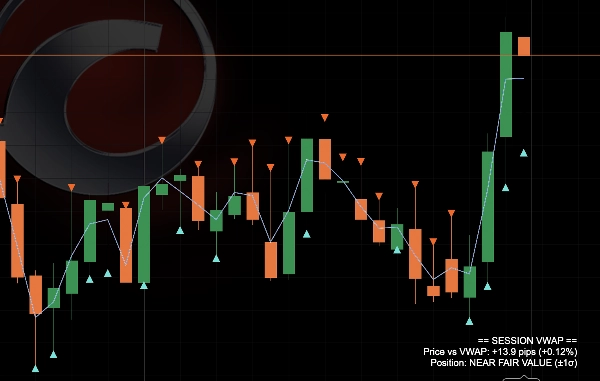
- The white VWAP line is the session's volume-weighted fair value — price above it favours buyers for the session, below favours sellers.
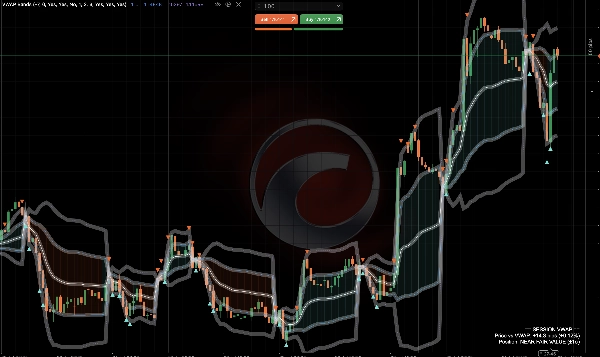
- The inner bands (1σ, solid) mark the normal trading range around fair value.
- The outer bands (2σ/3σ, dotted) mark statistically stretched zones — price rarely spends long beyond these without reverting or triggering a strong trend continuation.
- A soft gradient cloud shades the space between price and the 1st band, shifting colour depending on which side of VWAP price is trading — a quick visual read of session bias.
- Small triangle markers print automatically whenever price wicks beyond the 2nd deviation band and closes back inside — a flag for potential mean-reversion at an extreme.
- The panel in the corner gives a live plain-English read: distance from VWAP in pips and %, plus a zone label like "OVEREXTENDED ABOVE (2-3σ)."
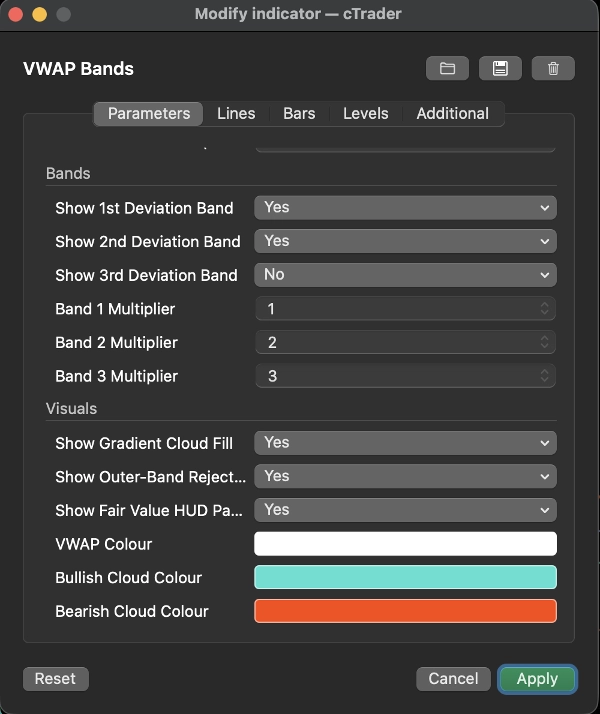
Key settings: session reset time (with a server-time-to-NY offset for accurate daily resets), independent on/off toggles and custom multipliers for each of the three band tiers, cloud fill and rejection marker toggles, and full colour customisation.
Typical use cases: judging intraday fair value on indices, forex majors, and gold; fading extended moves back toward VWAP when price tags the outer bands; using VWAP as dynamic intraday support/resistance; confirming whether a breakout is happening from a "stretched" or "fair value" starting point.
Best suited for: intraday and scalping traders who want an objective, statistically grounded read of fair value rather than a static line — useful for both discretionary bias-forming and as a confluence tool alongside other setups. Less relevant for pure long-term position traders.
Summary
The indicator calculates each bar’s typical price (average of high, low, and close) weighted by volume from the session start, deriving the running VWAP and standard deviation. The white VWAP line represents the session’s fair value, with price above favoring buyers and below favoring sellers. The inner bands mark normal trading ranges, while outer bands indicate statistically stretched price zones that often precede reversions or strong trend continuations.
Visual features include a gradient cloud shading between price and the first band, changing color based on price position relative to VWAP, and triangle markers signaling price rejection beyond the second deviation band, suggesting potential mean reversion. A corner panel displays live metrics such as distance from VWAP in pips and percentage, plus zone labels like "OVEREXTENDED ABOVE (2-3σ)."
Key settings allow customization of session reset time, band multipliers, cloud and marker toggles, and colors. VWAP Bands is suited for intraday and scalping traders seeking an objective, statistically grounded measure of fair value and dynamic support/resistance.
Discussion
Customer reviews
FAQ
More from this author


























!["[Hamster-Coder] Moving Average MTF" logo](https://cdn.ctrader.com/image/webp/b11b98b1-194d-4b8e-b00e-d611826ad159_31226)



Price