

Description
What it looks at
This isn't drawn off wicks or closes. For every bar, it builds a real volume profile using a rolling 5-bar window, splits the price range into 200 buckets, and finds where the most volume actually traded — that's the level it works from. It then scans that series for swing highs and lows using two lookback speeds: a fast one for recent pivots, and a slower, wider one for more established ones.
How to read it
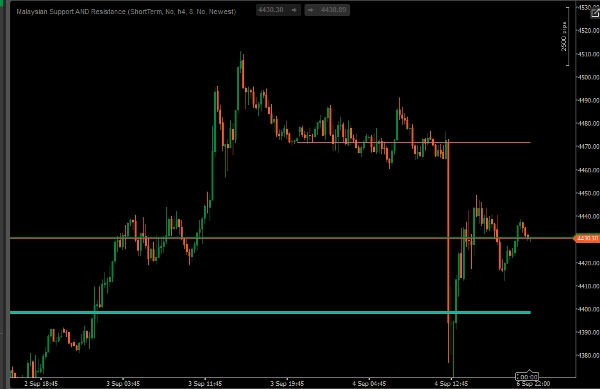
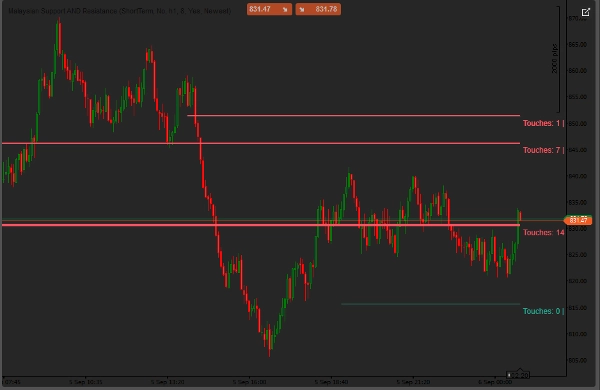
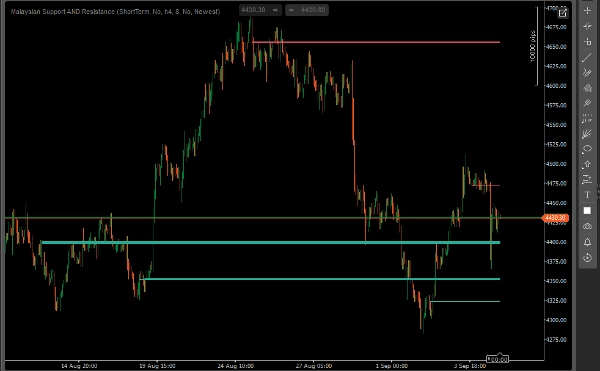
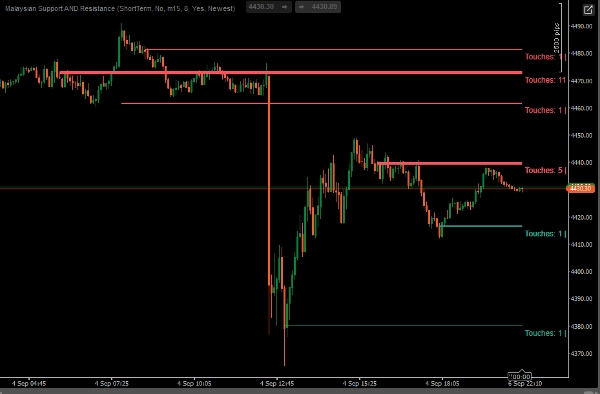
Each line is a support or resistance level. Color shows whether current price is above it (support) or below it (resistance). Thickness shows how important it is — how many times price has touched it and how much volume traded near it. Turn on "Show Touch | Volume Count" and hover a line to see the exact numbers. You'll see up to 8 levels at once: the newest fast-forming high/low, plus 3 more established highs and 3 more established lows.
Key settings
- Market View — Short Term / Standard / Long Term, controls how far back it looks for pivots
- Use Chart Timeframe or a specific Higher Timeframe
- Number of Lines to Show — 1 to 8
- Pick Levels By — Newest (most recent 3) or Strongest (most touched/highest volume 3, regardless of age)
- Show Touch | Volume Count — adds the numbers to each line
- Support/Resistance colors — fully customizable
Who it's for
Traders working price action, SMC, or ICT-style concepts who want objective support/resistance instead of drawing it by hand. Works best as a confluence layer alongside your own structure and liquidity reads, not as a standalone signal.
Worth knowing
- Levels only confirm once enough bars have passed to prove them — recent price won't move an already-confirmed level
- Volume is tick volume, standard for forex/CFDs/synthetics — not exchange traded volume
- Give it some history to work with. On a newly listed or quiet instrument you may see fewer than 8 levels at first, filling in as more pivots confirm
Summary
Displayed lines represent support or resistance, with color indicating whether the current price is above (support) or below (resistance) the level. Line thickness reflects importance based on the frequency of price touches and volume traded near the level. Users can view up to eight levels simultaneously, including the newest fast-forming pivots and multiple established highs and lows. Additional features include customizable settings for market view (short to long term), timeframe selection, number of lines shown, level selection criteria (newest or strongest), and display of touch and volume counts.
This indicator is designed for traders employing price action, Smart Money Concepts (SMC), or ICT-style methods who prefer objective support and resistance levels derived from volume data rather than manual drawing. It functions best as a complementary tool alongside other structural and liquidity analyses. The volume data used is tick volume, standard for forex, CFDs, and synthetic instruments.









!["[Stellar Strategies] Market Session Ultimate" logo](https://cdn.ctrader.com/image/webp/61ffd537-0125-4246-9e72-42eca1791d64_28232)







