
NexoStructureAtlas
지표
버전 1.0, Oct 2026
Windows, Mac
4.3
리뷰: 3
가입일 03/10/2024
181
판매
46.05K
무료 설치
설명
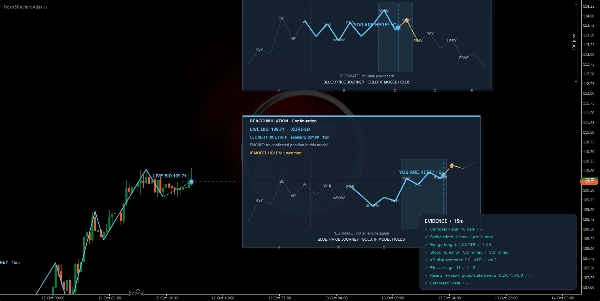
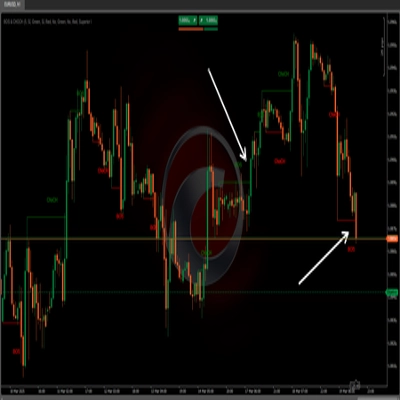
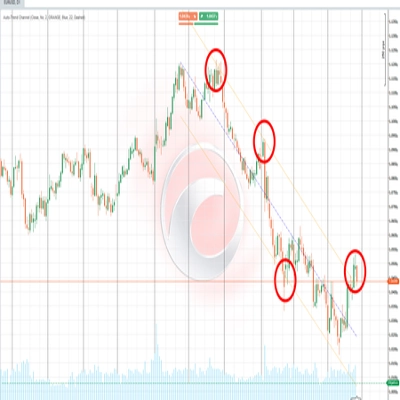
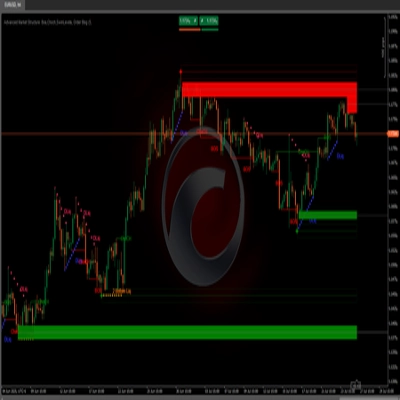
Nexo Structure Atlas는 시장 구조 및 기관 주기 역학을 기반으로 거래하는 트레이더를 위해 설계된 전문가급 기술 분석 도구입니다. 이 지표는 범위, 구조적 단계 및 주요 전환점을 자동으로 식별하며, 직관적인 시각적 가이드를 차트에 직접 투영합니다.
📊 분석된 시장 데이터 및 조건
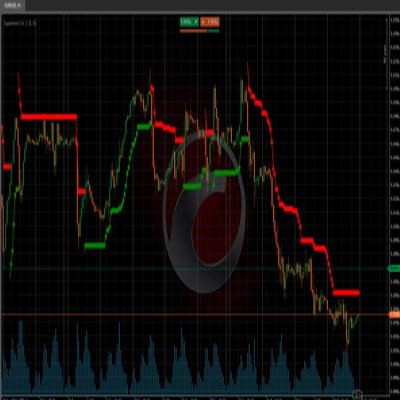
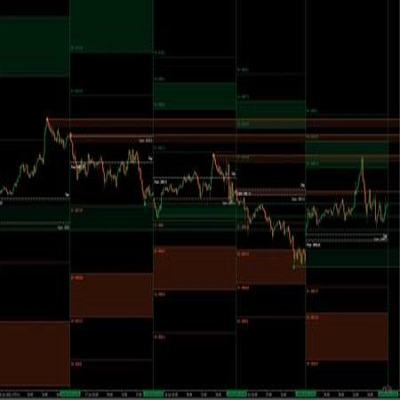
https://chartshots.spotware.com/c/6acd2589646ae
이 지표는 현재 차트와 상위 시간대의 가격 움직임을 처리합니다. 다음을 분석합니다:
- 가격 범위, ATR 진폭 및 스윙 폭(피벗).
- 축적, 분배, 재축적 및 재분배 단계의 발전 및 전환.
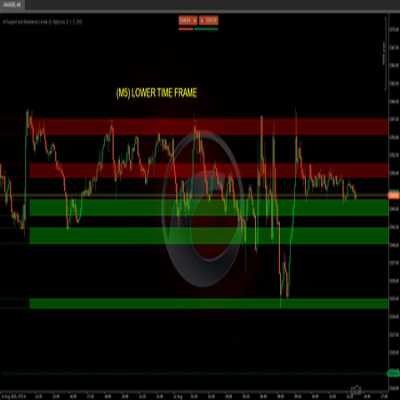
- 정지 동작, 최종 테스트 및 기관의 지지/저항 유동성 수준.
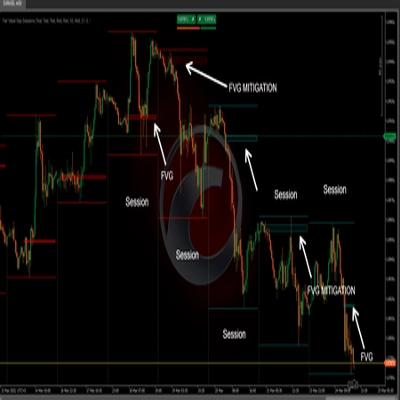
https://chartshots.spotware.com/c/6acd25cee9110
👁️ 시각적 요소 및 신호 해석 방법
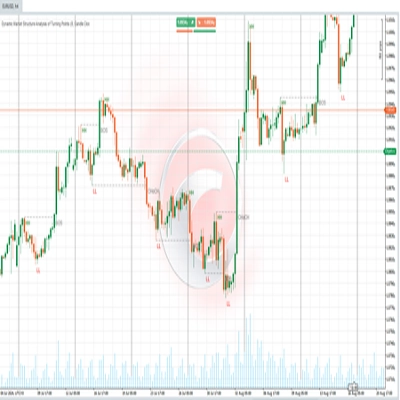
https://chartshots.spotware.com/c/6acd260deee0e
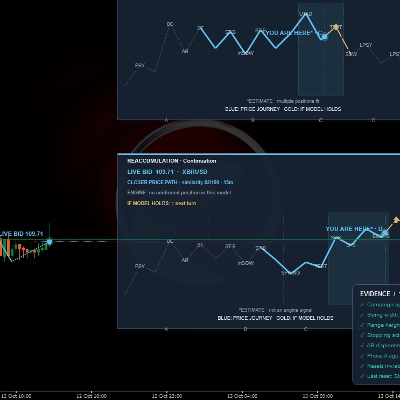
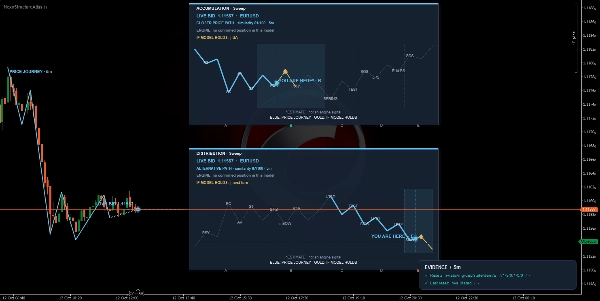
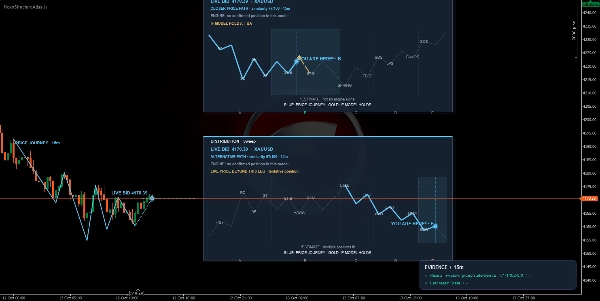
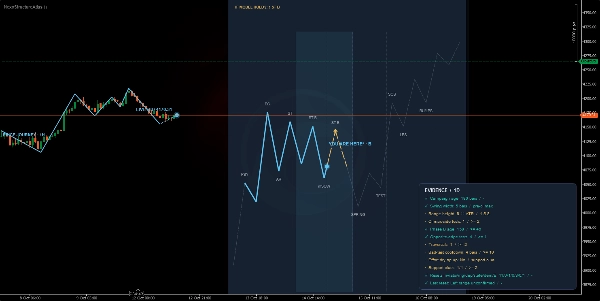
- 참조 카드: 현재 주기의 이상적인 스키마(예: 스윕 또는 축적/분배 모델)를 보여주는 선택적 중첩 패널로, 가격이 이론적 모델 내 어디에 위치하는지 시각적으로 비교할 수 있습니다.
- 가격 이동 추적: 차트에 중요한 가격 움직임과 스윙을 그려 추세 구조와 특성 변화를 명확하게 시각화합니다.
- 진입 배지: 구성된 필터링 정책에 따라 주요 구조적 지점(예: 단계 테스트, 지지/저항 테스트, 추세 확인)에서 잠재적 고확률 기회를 알리는 차트상의 시각적 표시기입니다.
- 증거 및 요약 대시보드: 현재 캠페인의 중요한 지표(단계 나이, ATR 내 범위 높이, 검증 상태 및 지지 지표)를 자세히 보여주는 은밀한 정보 패널입니다.
⚙️ 주요 설정 및 매개변수
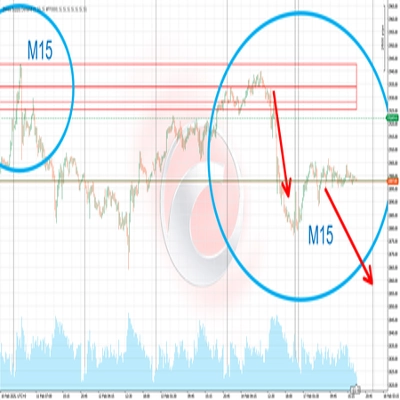
https://chartshots.spotware.com/c/6acd26ad835f3
이 지표는 cTrader에서 접근 가능한 그룹으로 나누어진 광범위한 사용자 정의를 제공합니다:
- 참조 아틀라스: 모델 선택(자동 또는 수동), 표시 가능한 참조 카드 수, 수평 오프셋 및 타이포그래피 크기.
- 구조 및 역사: 라이브 경로 활성화, 상위 시간대 역사 분석 및 최소 단계별 필터링.
- 신호 및 컨텍스트: 진입 자격 정책(보수적, 표준, 공격적) 및 추가 진입 트리거 선택.
- 대시보드 및 시각적 정체성: 전체 색상 사용자 정의(수요에 대한 제이드 톤, 공급에 대한 산호색, 표면 및 텍스트 색상), 범위 불투명도, 선 두께 및 확인된 진입에 대한 사운드 알림.
🎯 사용 사례 및 거래 시나리오
- 기관 범위 식별: 자산이 원인(축적/재축적) 또는 결과(분배/재분배)를 구축할 때 감지하는 데 이상적입니다.
- 전환점 거래: 진입 배지와 단계 테스트를 사용하여 정의된 위험 관리와 함께 주요 구조적 움직임에 유리한 포지션 진입을 모색합니다.
⚠️ 중요한 제한 사항 및 사용 주의사항
- 이 지표는 시간 기반 차트(분, 시간, 일, 주 또는 월)를 필요로 합니다.
- 고급 기술 분석 및 의사결정 지원 도구이며, 자동화된 금융 조언을 제공하거나 자체적으로 수익을 보장하지 않습니다. 적절한 위험 관리와 자신의 운영 전략에 따른 검증이 권장됩니다.
요약
AI 요약
NexoStructureAtlas is a technical analysis indicator focused on market structure and institutional cycle mapping. It analyzes price action on the current and higher timeframes to identify key ranges, structural phases (accumulation, distribution, reaccumulation, redistribution), and turning points. The tool visualizes these insights directly on the chart through several features:
- Reference Cards: Overlapping panels display ideal cycle schemas for visual comparison with actual price behavior.
- Price Journey Trace: Highlights significant price swings and trend structure changes.
- Entry Badges: Markers indicating potential high-probability entry points at critical structural levels.
- Evidence and Summary Dashboard: Provides metrics such as phase age, range height (ATR), validation status, and support levels.
Users can customize model selection, visible reference cards, signal filtering policies (conservative to aggressive), and visual elements including colors and alerts. The indicator supports time-based charts (minutes to months) and is designed to assist in institutional range identification and turning point trading strategies by highlighting key levels, market structure shifts, liquidity grabs, and support/resistance zones. It outputs visualizations and entry signals based on price bars without automated trade execution.
- Reference Cards: Overlapping panels display ideal cycle schemas for visual comparison with actual price behavior.
- Price Journey Trace: Highlights significant price swings and trend structure changes.
- Entry Badges: Markers indicating potential high-probability entry points at critical structural levels.
- Evidence and Summary Dashboard: Provides metrics such as phase age, range height (ATR), validation status, and support levels.
Users can customize model selection, visible reference cards, signal filtering policies (conservative to aggressive), and visual elements including colors and alerts. The indicator supports time-based charts (minutes to months) and is designed to assist in institutional range identification and turning point trading strategies by highlighting key levels, market structure shifts, liquidity grabs, and support/resistance zones. It outputs visualizations and entry signals based on price bars without automated trade execution.
지표 프로필
지표 카테고리
시장 구조 (SMC)
출력 유형
시각화
신호
데이터 요구 사항
막대만
지원되는 신호
돌파
반전
레벨 터치
레벨 돌파
상담
고객 리뷰
4.3
리뷰: 3
5 | 33 % | |
4 | 67 % | |
3 | 0 % | |
2 | 0 % | |
1 | 0 % |
고객 리뷰
October 29, 2026
phase age, range size and evidence status give the accumulation and distribution interpretations useful detail. Reference cards help explain the labels instead of leaving them isolated. The readings remain classifications of price behaviour rather than confirmed institutional positions.
October 19, 2026
reference cards explaining phase age, range and evidence status make the structure atlas much more useful than a lone accumulation or distribution badge, without claiming to reveal actual institutional positions.
October 18, 2026
age, range size and evidence status make the phase labels more inspectable, with reference cards providing context for accumulation or distribution readings rather than claiming direct knowledge of institutional trades.
자주 묻는 질문(FAQ)
Key Levels
MSS
CHOCH
Market Structure
ATR
Liquidity Grab
Support & Resistance
트레이딩 봇, 지표, 플러그인 등 cTrader Store에서 제공되는 상품은 제3자 개발자에 의해 제공되며, 이는 단순히 정보 및 기술적 접근을 목적으로 제공된 것입니다. cTrader Store는 중개인이 아니며, 투자 조언, 개인별 추천 또는 향후 성과에 대한 어떠한 보장도 제공하지 않습니다.

가격
가입일 03/10/2024
181
판매
46.05K
무료 설치