설명
Pinescriptlabs 스토어 지표: Pinescriptlabs 스토어 cBots : (cBot) Gold & BTC BreakoutSession Pivots(new)
PRICE ACTION (New)
Prediction Based on Linreg & ATR
SmartTrend Support &
Resistance
Lines
Dynamic
Market Structure
Analysis
of
Turning
Points
Fibonacci
Linear
Regression
Multi-timeframe
Multi-Level
Candle Bias
Tracker
Auto
Support and
Resistance
Trend
Lines
All
Support and
Resistance
Levels
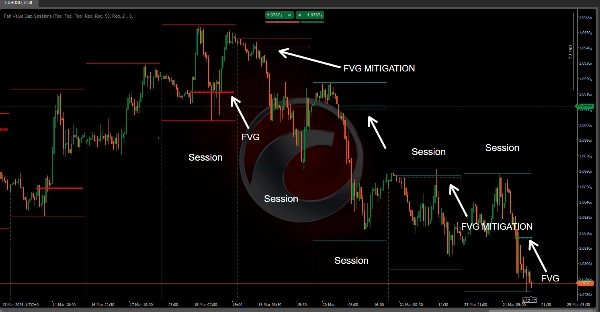
Fair Value Gap Sessions 📊💰
Fair Value Gap (FVG) 지표는 특정 거래 세션 내에서 "공정 가치 갭"으로 알려진 일시적인 시장 비효율성을 식별하고 강조하기 위해 설계된 정교한 거래 도구입니다 🚨. 이 갭은 시장 가격이 빠르게 움직여 ⚡ 매수자와 매도자 간의 불균형을 만드는 순간을 나타냅니다.
주요 기술 메커니즘 🔧
세션 기반 아키텍처 🕒
• 정밀하고 구성 가능한 세션 기반 분석 방식을 구현
• 거래자가 UTC 또는 현지 시간대 지원으로 사용자 지정 세션 시작 시간을 정의할 수 있음 🌍
• 시장 행동을 재설정하고 추적하는 동적 세션 경계 생성 🔄
공정 가치 갭 감지 논리 🔎
• 여러 연속 가격 막대에 걸친 고급 가격 행동 분석 사용
• 다음을 비교하여 갭 식별:
o 연속 막대의 최고가 및 최저가 📈📉
o 이전 막대의 종가 ✅
o 현재 막대의 가격 구조 🔄
갭 분류 🏷️
이 지표는 두 가지 주요 갭 유형을 구분합니다:
- 강세 공정 가치 갭 📈
o 가격이 이전 최고가를 넘을 때 발생 🔺
o 잠재적 상승 시장 모멘텀을 나타냄 🚀
o 매수 압력 가능성을 신호함 💸 - 약세 공정 가치 갭 📉
o 가격이 이전 최저가 아래로 떨어질 때 발생 🔻
o 잠재적 하락 시장 모멘텀을 시사 ⬇️
o 매도 압력 가능성을 신호함 🛑
거래 응용 📱💼
전략적 통찰력 💡
• 거래자가 시장 비효율성을 시각화하는 데 도움 🖼️
• 잠재적 추세 반전의 조기 경고 제공 ⚠️
• 정확한 진입 및 종료 지점 식별 제공 🎯
위험 관리 기능 🛡️
• 갭 상태의 색상 코딩 시각화 🎨
• 갭 "완화"(가격이 갭 영역으로 돌아올 때) 추적 ↔️
• 다양한 시장 조건에 맞춘 사용자 지정 색상 설정 허용 🎨
기술적 시각화 🎨
이 지표는 두 가지 주요 시각적 요소를 생성합니다:
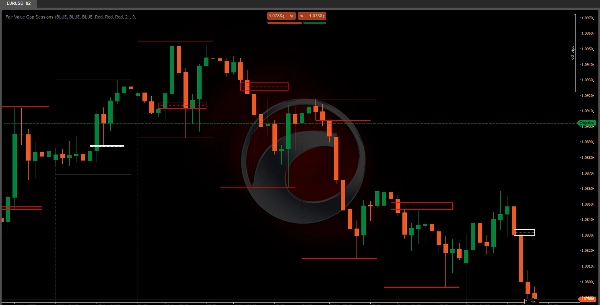
- 갭 영역 사각형 🟩
o 식별된 갭의 가격 범위를 나타냄 📐
o 거래 세션 전체에 걸쳐 동적으로 확장 ➡️
o 갭 상태(활성/완화)에 따라 색상 변경 🟩➡️🟨 - 레벨 라인 📏
o 갭의 중간 지점에 위치 ⚫
o 거래자가 갭의 중심 가격 영역을 빠르게 식별하도록 도움 📍
o 갭 상태를 나타내기 위해 다양한 선 스타일 사용 ➔
실용적인 거래 전략 📝
진입 신호 전략 🚦
• 갭 감지를 잠재적 추세 지속 신호로 사용 🔄
• 갭으로 가격이 돌아오는 것(완화)을 확인 신호로 확인 ✅
• 견고한 의사 결정을 위해 다른 기술 지표와 결합 🤝
위험 관리 기법 🛡️
• 갭 경계 근처에 스톱로스 설정 ⛔
• 갭 중간점을 잠재적 지지/저항 레벨로 사용 🪜
• 갭 완화를 잠재적 추세 반전 지표로 모니터링 ↔️⚠️
구성 유연성 ⚙️
• 사용자 지정 가능한 세션 시작 시간 ⏰
• 시간대 구성 (UTC/현지) 🌍
Fair Value Gap Sessions 지표를 이해하고 적절히 구현함으로써, 거래자들은 시장 역학에 대한 더 깊은 통찰을 얻고, 잠재적 거래 기회를 식별하며, 가격 행동 비효율성에 기반한 보다 정보에 입각한 결정을 내릴 수 있습니다. 🧠📈
요약
It classifies gaps into two types: bullish gaps, indicating potential upward momentum and buying pressure, and bearish gaps, signaling possible downward momentum and selling pressure. Visually, it represents gaps with dynamic rectangles showing the price range and a midpoint level line to help traders quickly locate the gap's central price zone. Colors and line styles change to reflect the gap's active or mitigated status.
Traders can use this tool to visualize market inefficiencies, receive early warnings of trend reversals, and identify precise entry and exit points. Risk management features include color-coded gap states, tracking of gap mitigation when price returns to the gap zone, and customizable color settings. The indicator supports practical strategies such as using gap detection for trend continuation signals and combining it with other indicators for decision-making. Stop-loss placement near gap boundaries and monitoring gap mitigation for trend reversal are also supported.
고객 리뷰
5 | 100 % | |
4 | 0 % | |
3 | 0 % | |
2 | 0 % | |
1 | 0 % |