
Açıklama
Pinescriptlabs Mağaza göstergeleri: Pinescriptlabs Mağaza cBots : (cBot) Gold & BTC BreakoutOturum Pivotları(yeni)
Gelişmiş Piyasa Yapısı: Bos, Choch, SwinLevels, Emir Blokları, Piyasa Yapısı & Likidite Bulucu (Yeni)
ZigZag Fiyat Likidite Projeksiyonu
Akıllı Takip Algoritması (yeni)
AkıllıTrend Destek &
Direnç
Çizgileri
Dinamik
Piyasa Yapısı
Analizi
Dönüş
Noktaları
Analizi
Fibonacci
Doğrusal
Regresyon
Çok Zamanlı
Çok Seviyeli
Mum Eğilimi
Takipçisi
Otomatik
Destek ve
Direnç
Trend
Çizgileri
Tüm
Destek ve
Direnç
Düzeyleri
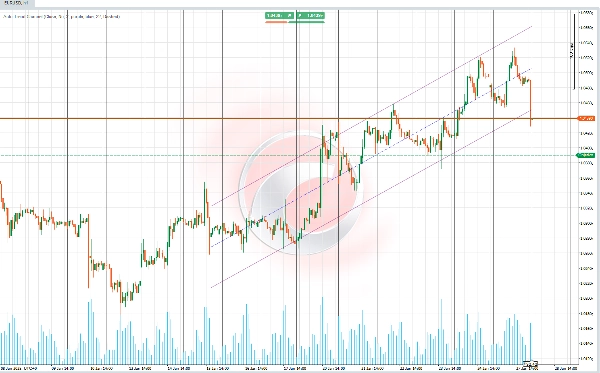
📊 Otomatik-Trend Kanalı 📊
Bu gösterge, otomatik olarak seçilen bir dönem için fiyat verilerinin doğrusal regresyon ve standart sapma (logaritmik) hesaplamasına dayalı bir trend kanalı çizer. 📈 Dönem, en yüksek mutlak değere sahip olanı seçerek Pearson korelasyon katsayısı (RRR) kullanılarak belirlenir. 🧮
✨ Ana İşlevsellik ✨
Birincil işlevsellik, gelişmiş istatistikler kullanarak destek, direnç ve merkezi trend çizgisi tanımlayarak, en temsilci dönem uzunluğuna otomatik olarak uyum sağlayan bir trend kanalı hesaplamaktır.
Kanal şunları içerir:
1️⃣ Hesaplanan doğrusal trendi temsil eden bir temel çizgi.
2️⃣ Kanal bantlarını standart sapmaya orantılı bir mesafede tanımlayan üst ve alt çizgiler.
🚀 Özellikler ve Hesaplamalar 🚀
🔎 Optimal Dönem Hesaplaması
- Gösterge, piyasa davranışına en doğru korelasyona sahip olanı bulmak için birden fazla veri dönemini (kısa veya uzun, yapılandırmaya bağlı olarak) değerlendirir.
- Anahtar metrik olarak Pearson korelasyonu kullanılır ve tarihsel fiyat ile oluşturulan trend çizgisi arasındaki en güçlü ilişkiye sahip dönem belirlenir.
📐 Doğrusal Regresyon ve Fiyat Projeksiyonu
- Her değerlendirilen dönem için, aşırı varyasyonları stabilize etmek amacıyla fiyatların doğal logaritmasına dayalı bir regresyon çizgisi hesaplanır.
- Hesaplamanın ana bileşenleri şunlardır:
-
- Eğim: Fiyat değişim oranını temsil eder.
- Kesişim: Projeksiyon çizgisinin başlangıç noktası.
- Ortalama: Referans temel çizgiyi oluşturur.
📊 Standart Sapma ve Kanal Sınırları
- Fiyatların regresyon çizgisine göre standart sapması hesaplanır.
- Üst bant (direnç) ve alt bant (destek), kullanıcı tarafından yapılandırılabilen standart sapma çarpanı ile merkezi çizginin ayarlanmasıyla türetilir.
🌈 Trend Kanalı Görselleştirmesi
- Kanal üç ana unsurdan oluşur:
-
- Merkezi Çizgi: Regresyon çizgisine dayalı ana trendi gösterir.
- Üst Çizgi: Standart sapma ile ayarlanmış kanalın üst sınırını (direnç) temsil eder.
- Alt Çizgi: Standart sapma ile ayarlanmış kanalın alt sınırını (destek) temsil eder.
- Kullanıcılar, daha iyi görsel netlik için kanalın renklerini, şeffaflığını ve çizgi stillerini özelleştirebilir.
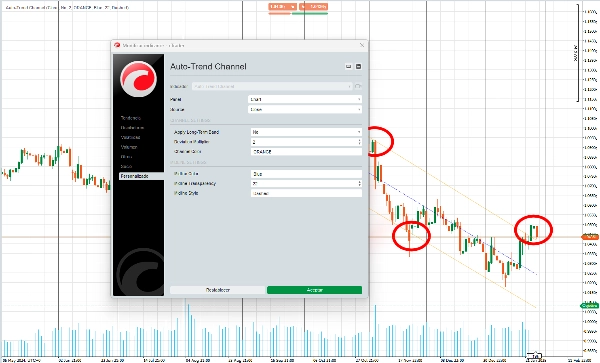
🎛️ Uyarlanabilirlik ve Yapılandırma
- Kullanıcılar, göstergenin çeşitli yönlerini kişiselleştirebilir, örneğin:
-
- Çizgilerin ve kanalın renkleri.
- Makro trendler için uzun dönemlere veya mikro trendler için kısa dönemlere odaklanma tercihi.
- Bu uyarlanabilirlik, göstergenin farklı ticaret stillerine ve görsel tercihlere uygun olmasını sağlar.
🔍 Kullanım :
1️⃣ Trend Tanımlama
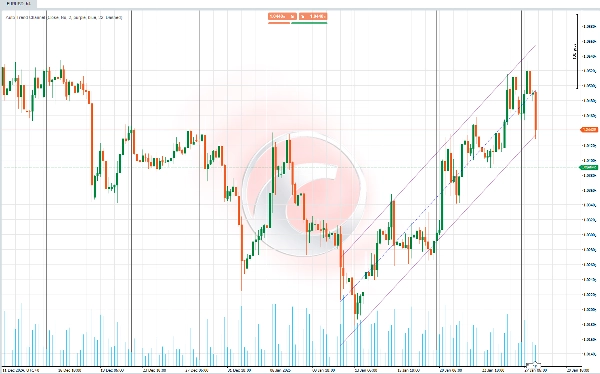
- Kanalın merkezi çizgisi, piyasanın bir yükseliş trendinde, düşüş trendinde veya yanlamasına trendde olup olmadığını belirlemeye yardımcı olur.
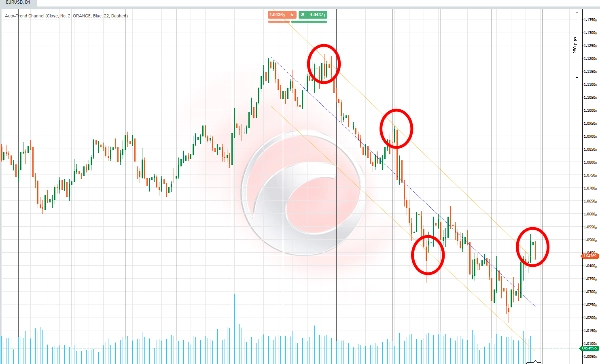
2️⃣ Dinamik Destek ve Direnç
- Üst ve alt kanal çizgileri, fiyatın geri dönebileceği veya konsolide olabileceği potansiyel bölgeler olarak işlev görür.
3️⃣ Konsolidasyon ve Kırılma Tespiti
- Fiyatların kanal içinde kalması konsolidasyonu, kırılma ise trend değişimini veya güçlü fiyat hareketini gösterir.
4️⃣ Farklı Ticaret Stillerine Uyarlama
- Uzun dönemler, genel trendleri tanımlamak ve daha geniş zaman dilimlerinde stratejik kararlar almak için faydalıdır.
- Kısa dönemler, yatırımcıların daha hızlı hareketleri yakalamasına ve anlık piyasa değişikliklerine tepki vermesine olanak tanır.
Özet
Key features include:
- Optimal period selection by evaluating multiple data intervals to find the strongest correlation between historical prices and the trend line.
- Calculation of slope, intercept, and mean for precise linear regression and price projection.
- Visualization of the trend channel with customizable colors, transparency, and line styles.
- Adaptability for different trading styles by allowing focus on long-term (macro) or short-term (micro) trends.
Use cases:
- Identifying market trends (uptrend, downtrend, sideways) via the central trend line.
- Detecting dynamic support and resistance zones where price may reverse or consolidate.
- Recognizing consolidation phases within the channel and breakouts signaling trend changes or strong price movements.
- Adjusting analysis to suit strategic decisions or faster market responses depending on selected period length.
This indicator supports various markets including cryptocurrencies (BTCUSD), commodities (XAUUSD), and others, providing a statistical approach to trend and channel analysis.
Müşteri değerlendirmeleri
5 | 60 % | |
4 | 20 % | |
3 | 20 % | |
2 | 0 % | |
1 | 0 % |


