Açıklama
Index Hunter: Genel Bakış
Index Hunter, öncelikle US30 (Dow Jones) ve NAS100 (Nasdaq) gibi yüksek volatiliteye sahip endeksler için tasarlanmış özel bir teknik gösterge ve karar destek sistemidir. Sadece geçmiş verileri gösteren standart göstergelerin aksine, Index Hunter "Vektör Tahmini" üzerine odaklanır — mevcut hız (eğim) temel alınarak fiyatın gelecekte 4 mum sonra nerede olacağını çoklu zaman dilimlerinde projelendirmeye çalışır.
1. Temel Mekanikler (Nasıl Çalışır)
A. "Vektör" Tahmin Motoru
Bu aracın kalbidir. Sadece mevcut fiyata bakmaz; M5, M15 ve H1 zaman dilimleri boyunca değişim oranını (Eğim) hesaplayarak grafiğinizde bir "Gelecek Yolunu" çizer.
- Mekanik: Farklı zaman dilimlerinden momentumun ağırlıklı ortalamasını hesaplayarak geleceğe 4 nokta (P1, P2, P3, P4) projekte eder.
- Görsel: Fiyatın sağ tarafında piyasanın ataleti görselleştiren renkli bir yol (Cam Göbeği -> Sarı -> Turuncu) görürsünüz.
- Hayalet Yol: Ayrıca önceki tahmini (Hayalet Yol) hatırlar, böylece piyasanın algoritmanın geçmiş projeksiyonlarına uyup uymadığını görebilirsiniz (bir "gerçeklik kontrolü").
B. Çok Katmanlı Görsel Sistem
Kritik kurumsal seviyeleri otomatik olarak üst üste bindirir:
- Pivot Noktaları (Esnek): Seçilebilir bir zaman dilimine (H12, Günlük, Gün2 veya Gün3) göre Pivot, R1/S1 ve R2/S2 seviyelerini otomatik olarak hesaplar.
- Psikolojik Seviyeler: Endeksler için manyetik bölgeler olarak sıkça işlev gören her 100 puan aralığında (örneğin, 34000, 34100) "Psikolojik Çizgiler" çizer.
- Günlük Yüksek/Düşük: Önceki günün aralığını işaretleyerek kırılma veya reddetme bölgelerini gösterir.
- Fraktallar: Kesin giriş/zarar durdurma yerleştirmesi için oklarla (▲ ▼) yerel tepeleri ve dipleri tanımlar.
C. "Güven" ve Uygulanabilirlik Mantığı
Araç sadece sinyal vermez; bunu derecelendirir.
- Hesaplama: Kar hedefinize olan mesafeyi ölçer ve bunu piyasanın mevcut enerjisi (ATR - Ortalama Gerçek Aralık) ile karşılaştırır.
- Çıktı:
-
- SICAK (>80%): Güçlü momentum + Makul hedef mesafesi.
- ILİK (50-80%): Orta düzeyde kurulum.
- SOĞUK (<50%): Piyasa hedefe ulaşma olasılığının düşük olduğunu varsayar (örneğin, hedef mevcut volatilite için çok uzak).
D. Hesap "Kalkanı" Mekanikleri
Panelde pasif bir risk yöneticisi içerir:
- Dayanıklılık Ölçütü: Bakiyeniz ve minimum lot büyüklüğünüz temel alınarak piyasanın hesabınıza zarar vermeden önce kaç "puan" hareket edebileceğini hesaplar.
- Durum: Hesabınız mevcut volatiliteye (ATR) göre güvenliyse "🛡️ INDEX SHIELD: ON" veya volatilite bakiyeniz için çok yüksekse "⚠️ DÜŞÜK MARJ" gösterir.
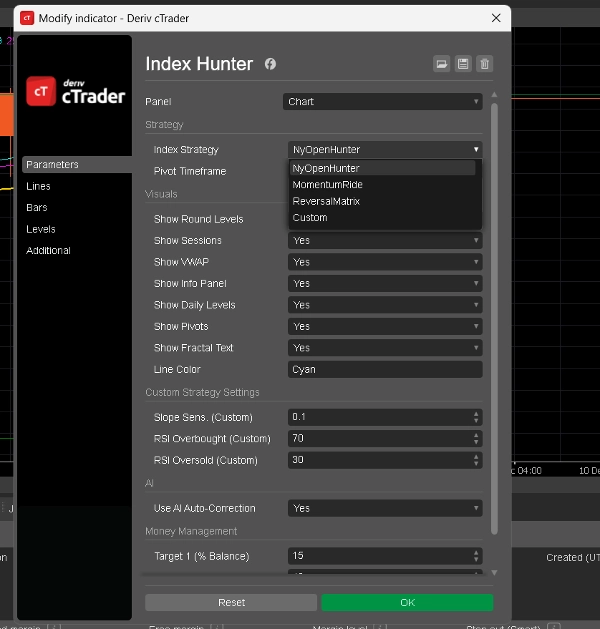
2. Mevcut Modlar (Stratejiler)
Bu modlar arasında gösterge ayarlarında geçiş yapabilirsiniz (
Index Strategy
parametresi). Her mod, AI'nın piyasayı yorumlama şeklini değiştirir.
1. Mod: NyOpenHunter (New York Scalper)
- En İyi: ABD Piyasası Açılışının kaotik ilk 2-3 saati için.
- Mantık:
-
- Aktif Zaman: 13:00 - 17:00 UTC (yaklaşık).
- Tetikleyici: M5 Eğiminin 0.1 üstünde (veya -0.1'in altında) olmasını arar.
- Felsefe: "Patlamayı yakala." NY zilindeki ilk hacim patlamasını bekler ve o belirli dalgayı sürmek için sinyal verir.
- Panel Duygusu: "NY OPEN BUY 🚀" veya "NY OPEN SELL 🔻" gösterir.
2. Mod: MomentumRide (Trend Takipçisi)
- En İyi: Açılış dışındaki güçlü, sürdürülebilir trendler için.
- Mantık:
-
- Tetikleyici: NY modundan daha güçlü bir M5 Eğimi (> 0.2) gerektirir.
- Felsefe: "Kırpılma." Zayıf hareketleri görmezden gelir ve piyasa güçlü bir kararlılıkla hareket ettiğinde sinyal verir.
- Panel Duygusu: "MOMENTUM UP 🟢" veya "MOMENTUM DOWN 🔴" gösterir.
3. Mod: ReversalMatrix (Ters Trend)
- En İyi: Aralıklı piyasalar veya tepeleri/dipleri yakalamak için.
- Mantık:
-
- Tetikleyici: RSI (Göreceli Güç Endeksi) kullanır.
-
- Satış Sinyali: RSI > 75 (Aşırı Alım).
- Alış Sinyali: RSI < 25 (Aşırı Satım).
- Felsefe: "Uçları sönümlendir." Lastik bandın çok fazla gerildiğini ve muhtemelen geri sıçrayacağını belirler.
- Panel Duygusu: "AŞIRI ALIM (YAKINDA SAT)" veya "AŞIRI SATIM (YAKINDA AL)" gösterir.
4. Mod: Özel (Kullanıcı Tanımlı)
- En İyi: Botu ayarlamak isteyen ileri düzey kullanıcılar için.
- Mantık: Ayarlar içinde kendi Eğim Hassasiyeti ve RSI seviyeleri için eşik değerlerinizi belirlemenize olanak tanır.
-
- Örnek: Sadece Eğim > 0.05 VE RSI < 40 olduğunda alım yapan hibrit bir strateji oluşturabilirsiniz.
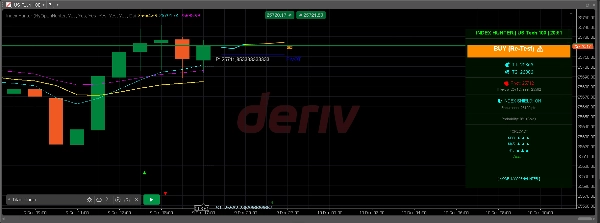
3. "Bilgi Paneli" (Heads-Up Display)
Grafiğin sağ tarafındaki görsel panel tüm bu verileri birleştirir:
- Başlık: Mevcut modu ve sembolü gösterir.
- Tercih: Ana AI eğilimi (örneğin, "BUY 34150 ▲").
- Hedefler (T1, T2): Hesap yüzdesi ayarlarınıza ve volatiliteye göre hesaplanan dinamik kar hedefleri.
- Tahmin: M30, M45 ve H1 trendlerinin ardışık analizi (örneğin, "M30: ▲ ▲ ▲" güçlü alım uyumu anlamına gelir).
- Olasılık: AI'nın güven skorunu (Sıcak/Ilık/Soğuk) gösterir.
Özet
Key features include an automatic overlay of institutional levels such as pivot points (with selectable timeframes), psychological price levels at 100-point intervals, previous day’s high/low, and fractals marking local tops and bottoms. It incorporates a confidence grading system (Hot, Warm, Cold) based on momentum strength and volatility relative to profit target distance.
Index Hunter includes a risk management "Shield" that assesses account safety by calculating potential adverse market moves against account balance and lot size, displaying status alerts accordingly.
The indicator offers four operational modes: NyOpenHunter (New York market open scalping), MomentumRide (trend following), ReversalMatrix (counter-trend using RSI), and a Custom mode for user-defined slope and RSI thresholds. A comprehensive info panel consolidates mode, bias, dynamic targets, trend forecasts, and confidence scores for decision support.
Müşteri değerlendirmeleri
5 | 67 % | |
4 | 33 % | |
3 | 0 % | |
2 | 0 % | |
1 | 0 % |